

Oxford Mathematician Vidit Nanda talks about his and colleagues Harald Oberhauser and Ilya Chevyrev's recent work combining algebraic topology and stochastic analysis for statistical inference from complex nonlinear datasets.
"It is not difficult to generate very complicated dynamics via very simple equations. Consider, for each parameter r > 0 and natural number n, the update rules
x_{n+1} = x_n + r y_n (1-y_n) mod 1, and
y_{n+1} = y_n + r x_n(1-x_n) mod 1,
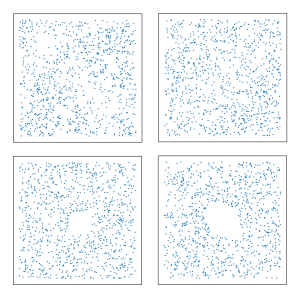
where the "mod 1" indicates that we restrict to the fractional part of the number, so for instance 3.7656 mod 1 is just 0.7656. These equations constitute a dynamical system on the unit square, and it turns out that the value of r makes an enormous difference to the behavior of this dynamical system. Below are typical pictures of the orbits (x_n,y_n) obtained (at r = 2.5, 3.5, 4, and 4.1 respectively) by applying the update rules to random initial choices of (x_0, y_0). The task for our machine, then, is to determine which r value has produced a given picture. If you were to see a fifth picture generated at one of these four r-values, you would have no trouble whatsoever determining which r was used. But it turns out to be very hard to efficiently teach a machine how to accurately make the distinction.
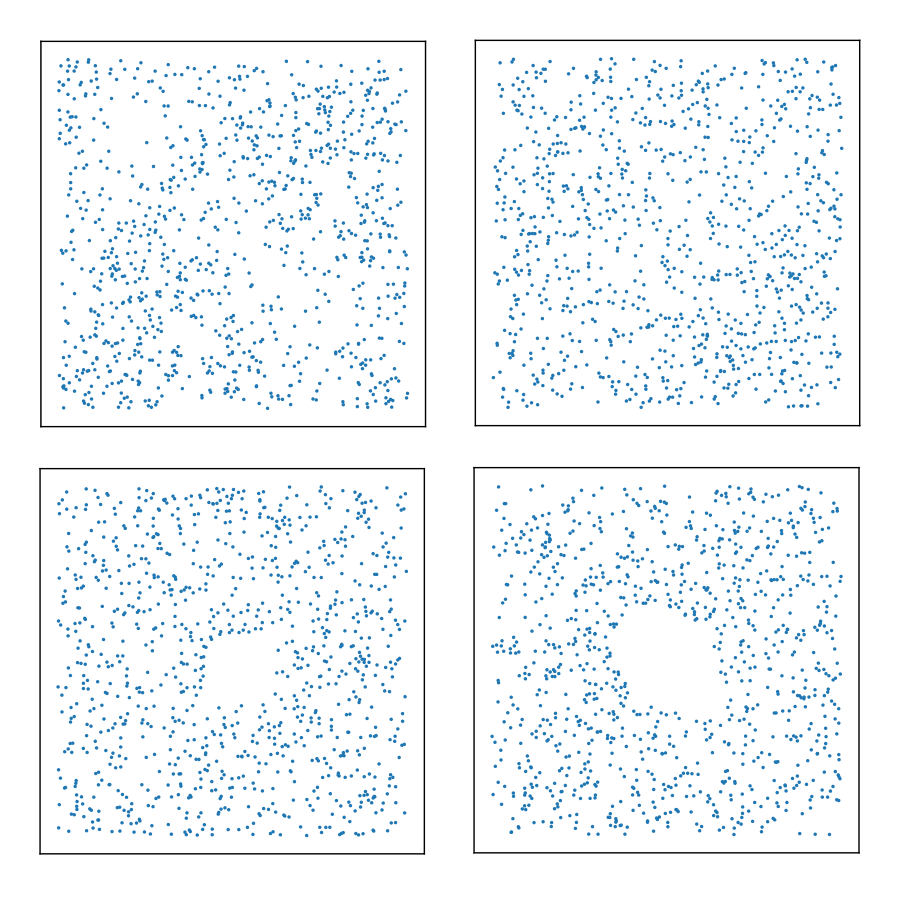
The difficulty lies, of course, in the nonlinearity of the dynamical system at hand. While machine learning methods are essentially linear, the geometry of the patterns is decidedly more complicated. One way to capture coarse nonlinear geometry is via the methods of topological data analysis. These reduce complicated point clouds (such as the aforementioned orbit images) to persistence barcodes, which are simply collections of intervals [b,d) labelled by geometric dimension. In our case of 2D images, the only interesting dimensions are 0 and 1. An interval [b,d) in dimension 1 indicates that when the points were thickened to balls of radius b, a hole appeared in the image, and that this hole was filled in upon thickening further to a radius d > b. Fortunately, barcodes generated at different r-values are very different while barcodes generated at the same r-value are quite similar. Unfortunately, the space of barcodes itself is nonlinear, and hence not directly amenable to machine learning.
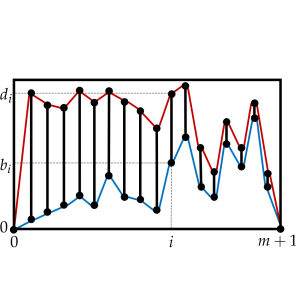
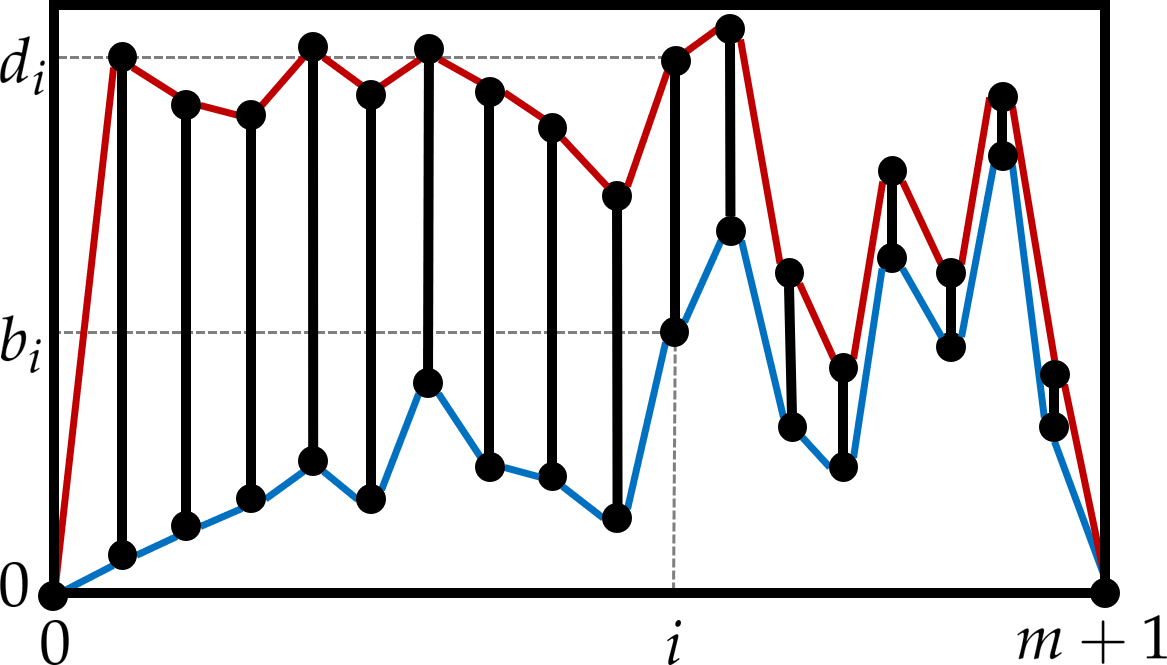
In order to allow machine learning methods to accept barcodes as input, we linearize the space of barcodes by turning them into paths. There are several nice ways of doing this, and the picture below indicates one of them: sort the intervals in a given barcode in descending order by their length, and construct the envelope curves obtained by joining all the successive b-values and d-values so obtained. Thus, each barcode produces two paths, and one can now compute the signature of those paths to obtain a (linear!) feature map that contains all the nonlinear geometric information necessary for our parameter-inference problem. On a standard benchmark dataset, this "barcode to path to signature" managed to correctly determine the r-value with an accuracy of 98.1%."
For more on this work please click here .