Oxford Mathematicians and Economists Maria del Rio-Chanona, Penny Mealy, Mariano Beguerisse-Díaz, François Lafond, and J. Doyne Farmer discuss their network model of labor market dynamics.
"Mathematics has explained many physical, chemical, and biological phenomena, but can it explain how the economy works? It is challenging because the economy is highly diverse, and ever-changing, with both short term fluctuations - it goes through recession and recovery periods - and long-term structural change - innovation transforms the scope and diversity of what we do.
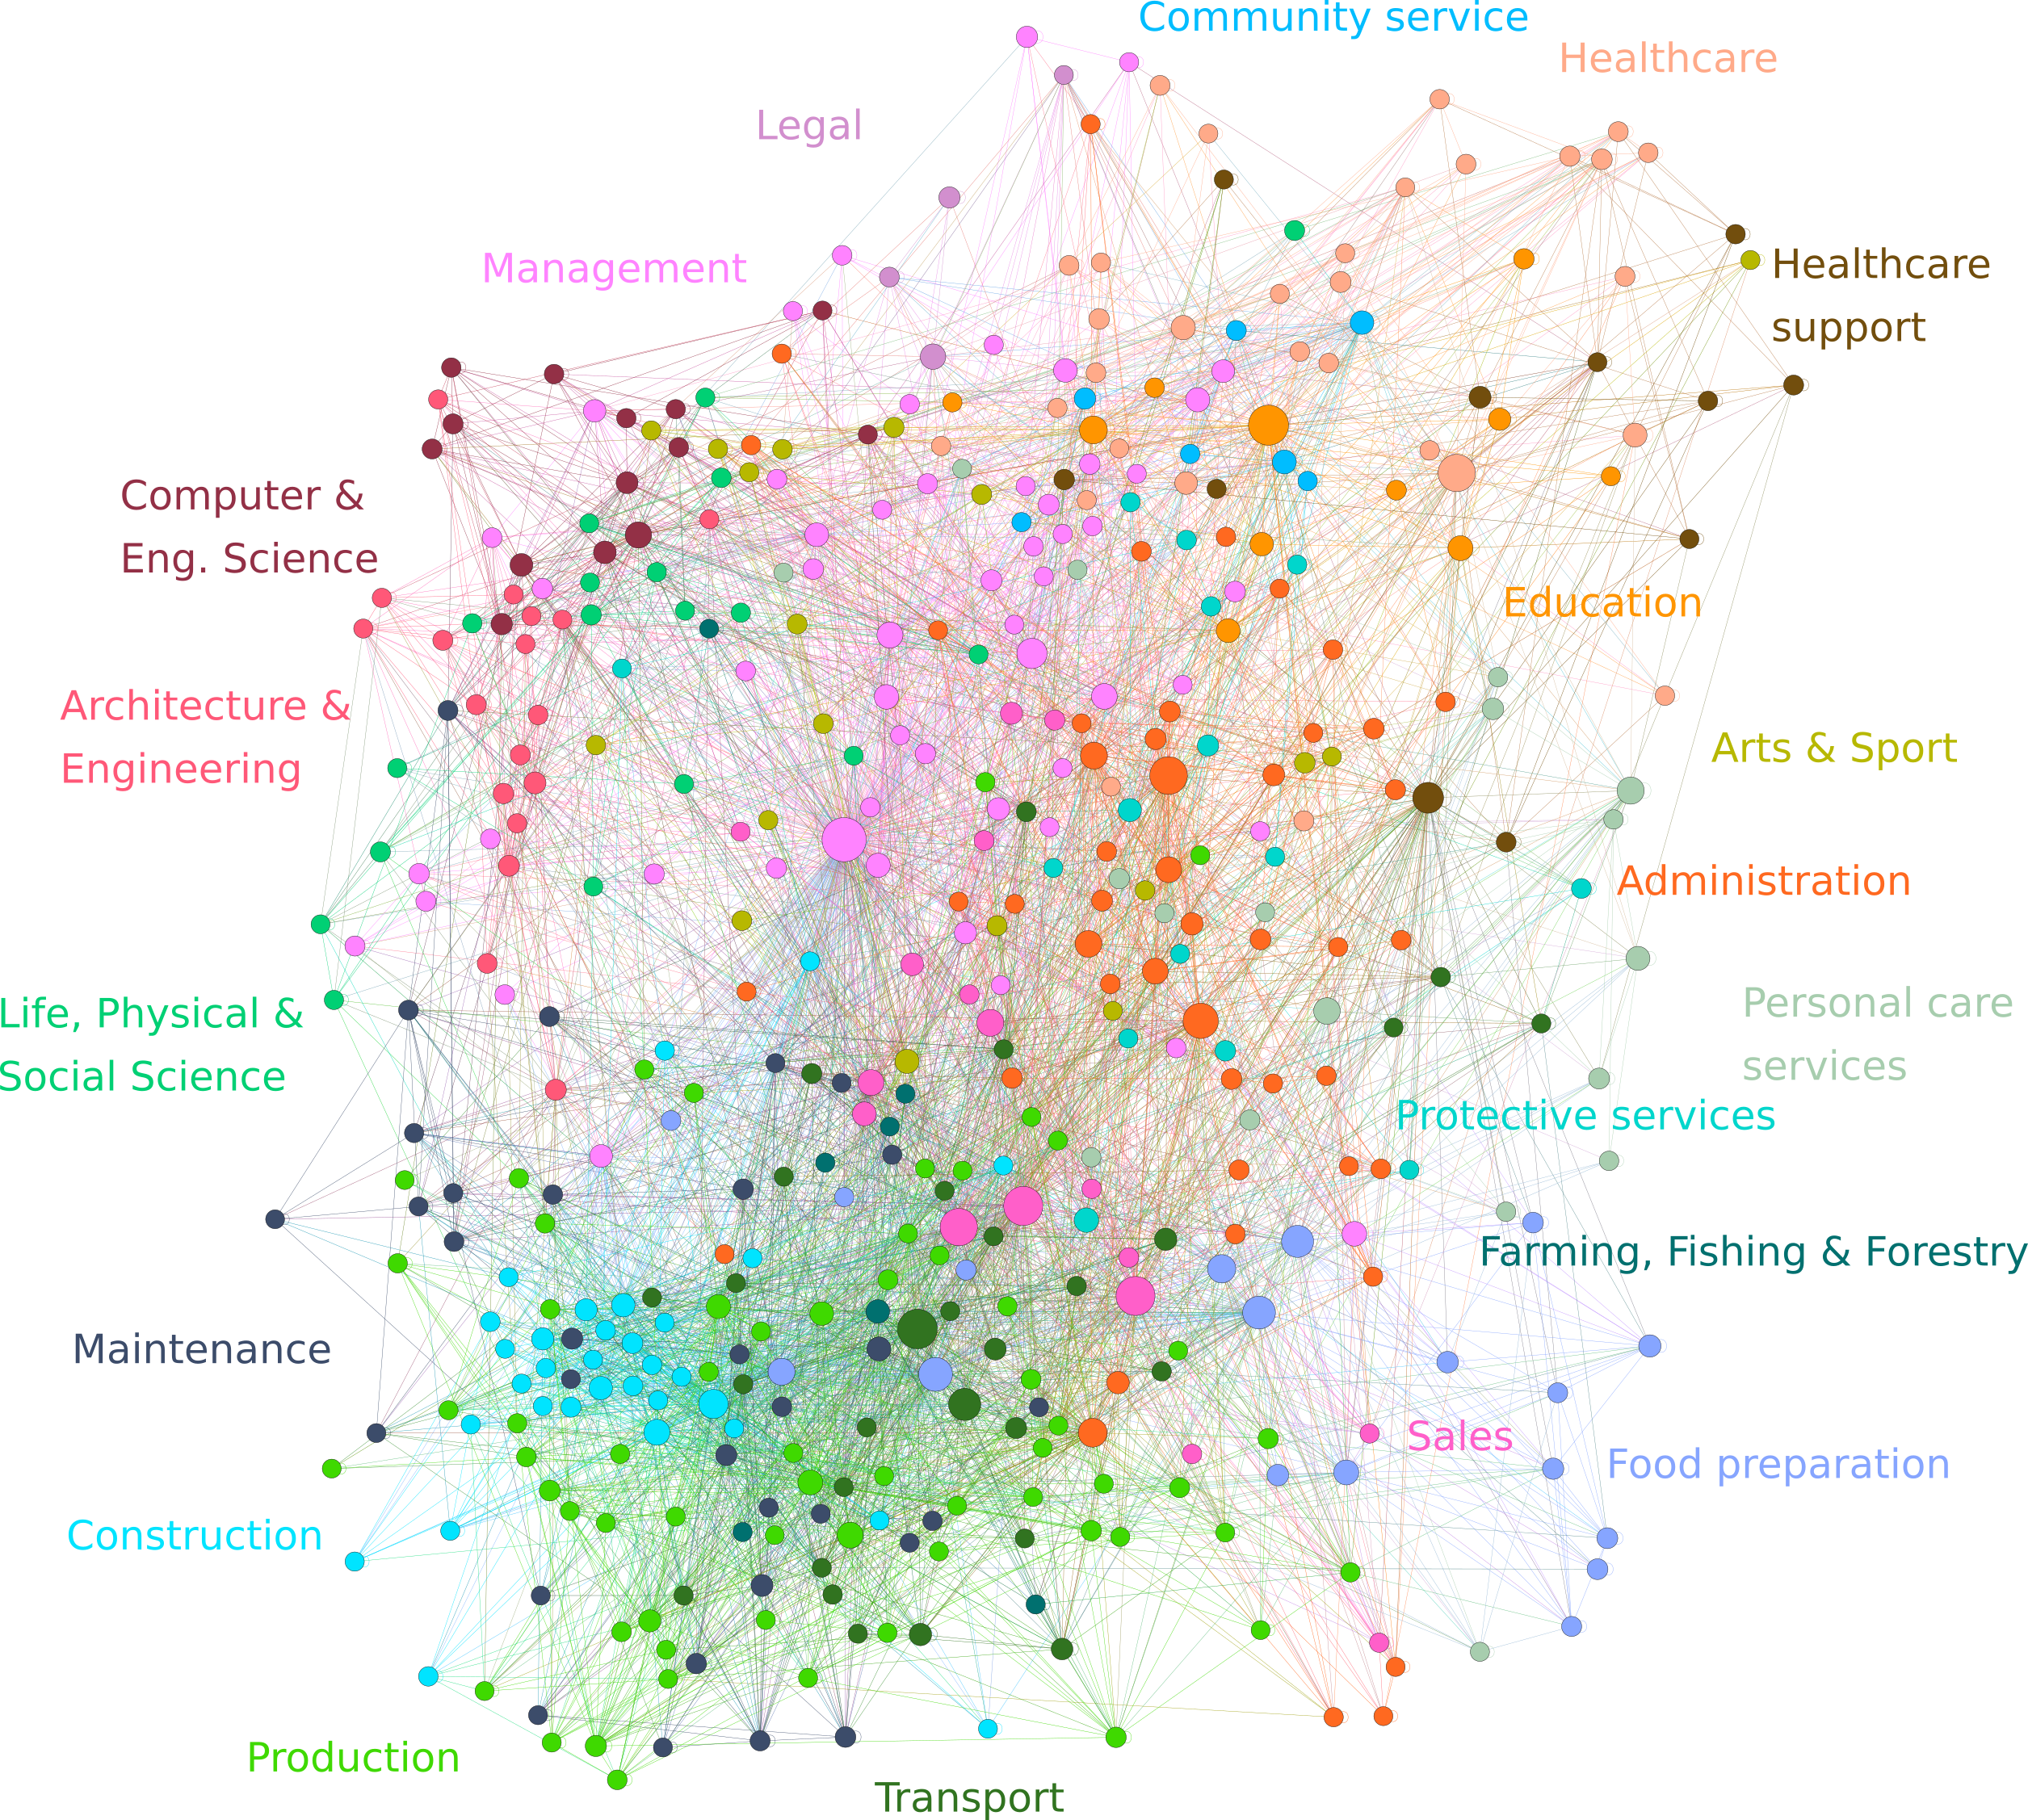
Take the labor market, for example. Figure 1 shows what we call the occupational mobility network (1) - each node is an occupation, and the links show how likely it is that a worker in an occupation moves to another occupation. Clearly, there are many different occupations, and some occupational transitions are more likely than others. How can we model the dynamics of the labor market while taking this into account (click figure to enlarge)?
Figure 1: Occupational mobility network. Nodes represent occupations, and links represent transitions of workers between occupations. The size of the nodes is proportional to the logarithm of the number of employees in each occupation. Nodes are coloured by their broad occupation classification.
We started from a simple model where firms fire (i.e. "separate'') and hire workers, and unemployed workers take up "accessible'' jobs, that is, job openings that are either in their current occupation, or one step away in the network. Our model is a computational, bounded-rational, non equilibrium model - agents follow simple rules, and we use a computer to simulate what happens. Computational models are very flexible, so they can be constructed around the best available data, without the need for over-simplifying the phenomenon being modelled. But they are computationally costly to run, and it is sometimes difficult to understand what precise mechanism is responsible for the behaviour of the model.
To solve these issues we also created a mathematically tractable model that, under some simplifying assumptions, represents well the more complex, computational model. For each occupation $i$, the key variables of interest (employment, unemployment and the number of opened vacancies) follow the laws of motion \begin{align*} \underbrace{\bar{e}_{i,t+1} - \bar{e}_{i,t}}_{\text{change in employment}} & = - \underbrace{ \Bigg( \delta_u \bar{e}_{i,t} + (1 - \delta_u) \gamma_u \max \big\{0, \bar{d}_{i,t} - d_{i,t}^\dagger \big\} \Bigg)}_{\text{separated workers}} + \underbrace{\sum_j \bar{f}_{ji, t+1,}}_{\text{hired workers}}\\ \underbrace{\bar{u}_{i,t+1}-\bar{u}_{i,t}}_{\text{change in unemployment}} & = \underbrace{ \Bigg( \delta_u \bar{e}_{i,t} + (1 - \delta_u) \gamma_u \max \big\{0, \bar{d}_{i,t} - d_{i,t}^\dagger \big\} \Bigg)}_{\text{separated workers}} - \underbrace{\sum_j \bar{f}_{ij, t+1,}}_{\text{transitioning workers}}\\ \underbrace{\bar{v}_{i,t+1} - \bar{v}_{i,t}}_{\text{change in vacancies}} & = \underbrace{ \Bigg( \delta_v \bar{e}_{i,t} + (1 - \delta_v) \gamma_v \max \big\{0, d_{i,t}^\dagger - \bar{d}_{i,t} \big\} \Bigg)}_{\text{opened vacancies}} - \underbrace{\sum_j \bar{f}_{ji, t+1.}}_{\text{hired workers}} \end{align*}
In these equations, the parameters $\delta_u$ and $\delta_v$ quantify how often workers are separated ($\delta_u$) and vacancies are opened ($\delta_v$) for completely random reasons, that is, independently of relative labor demand. The variable $d_{i,t}^\dagger$, which we take as given, represents the level of labor demand desired by employers, given the state of the economy. It is compared with the actual level, defined as the number of people employed plus the number of opened vacancies ($d_{i,t} = e_{i,t} + v_{i,t}$). The parameters ($\gamma_u$ and $\gamma_v$) then determines how much of the gap they close during one period, by separating workers if desired labor demand is less realised ($\gamma_u$), and by opening vacancies if desired labor demand is greater than realized ($\gamma_v$).
The movement of workers across occupations is captured by the last terms, where $f_{ij, t}$ is the number of workers previously employed in occupation $i$ that are hired in occupation $j$ at time $t$. These terms depend on the structure of the occupational mobility network, and on behavioural assumptions about how people look for a job and are matched to a vacancy.
The bar over the symbols for the variables ($e$,$u$,$v$,$d$,$f$) are a reminder that these are not the quantities from the full-fledged computational model, but only approximations (loosely speaking, averages over the ensemble of simulations, in the limit of a large number of agents).
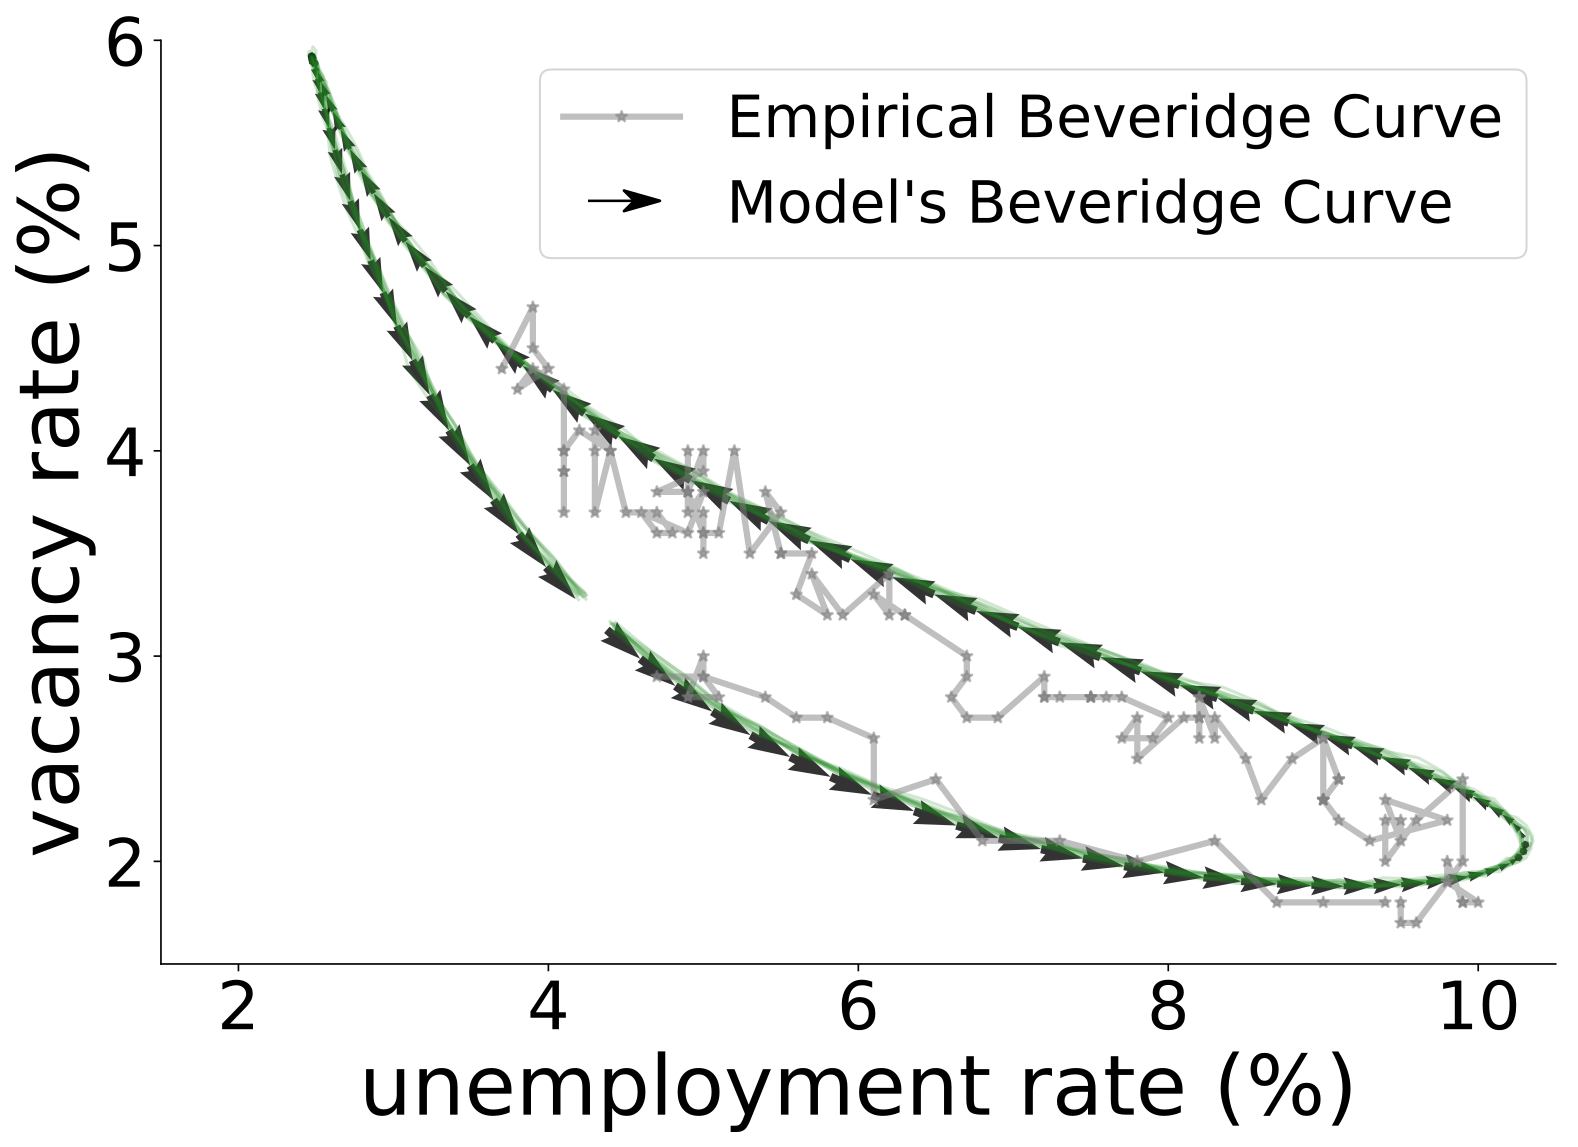
To test whether the model produces reasonable dynamics, we have shown that it is able to reproduce the Beveridge curve, a well-known macroeconomic stylized fact: when more vacancies open, unemployment goes down (Figure 2). As a proof-of-concept, we have used the model to anticipate the effects of future automation. Using predictions of what occupations robots and algorithms are likely to replace in the future, we used the model to understand the movement of workers in and out of occupations. Our key finding is that unemployment in an occupation depends not only on its direct exposure to automation, but also on the indirect exposure, via occupations close to it. Neighboring occupations that are not hard-hit make it easy for workers to find jobs there, but neighboring occupations that do suffer a large shock create an inflow of job seekers, and thus extra competition.
Figure 2: The Beveridge curve: the grey line shows the US empirical data between December 2007 and December 2018. The arrows correspond to the numerical solution of the system of deterministic equations, and the solid green lines correspond to ten simulations of the full stochastic model.
As the nature of work keeps evolving, policymakers will need quantitative tools to help them target employment assistance packages and skill development programs to those who need it most. Mathematical models can help with this."
[1] R. Maria del Rio-Chanona, Penny Mealy, Mariano Beguerisse-Díaz, François Lafond, and J. Doyne Farmer. Occupational mobility and automation: a data-driven network model. Journal of The Royal Society Interface, 18(174):20200898, 2021.


