

Glioblastoma is an aggressive form of brain tumour, which is characterised by life expectancies of less than 2 years from diagnosis and currently has no cure. The only intervention available to a patient is having the infected area of their brain cut away as soon as the tumour cells are observed. Unfortunately, even with our most sensitive biomedical imaging techniques, we are unable to see exactly where the tumour has spread. Thus, even though a surgeon may cut out the worst affected areas there may still be infected areas that are left to grow, allowing the tumour to re-emerge. Surgeons are, thus, turning to the predictive power of mathematics, which allows them to anticipate where the cells will be, even if they cannot be seen.
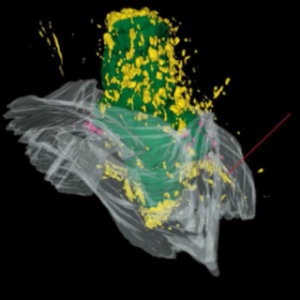
Simulations capturing the main effects of tumour invasion have been produced since the early 2000s. However, more recently, it has been experimentally observed that the tumour cells appear to congregate within the interfaces of the brain’s white and grey matter (see Figure 1), which is not accounted for by the previously developed models.
Oxford Mathematical biologists Thomas Woolley, Philip Maini and Eamonn Gaffney, in collaboration with José Belmonte-Beitia from the Universidad de Castilla-La Mancha and Jake Scott from the Moffitt Cancer Center have revisited this problem and found that they can reproduce these new observations by altering how a cell senses its surroundings.
The original model assumed that the cells could sense their environment far from their current locations. This leads to the simulations showing that the cells spread out evenly over the entire space. By assuming that the cells can only sense a local region the simulations show that the cells tend to form high density peaks along the white-grey matter interfaces (see Figure 2).
Critically, this new formulation changes our understanding of how the cells invade our brain tissue. Not only could this lead to better predictions of how tumours spread, but, consequently, more lives could be saved using mathematical modelling.
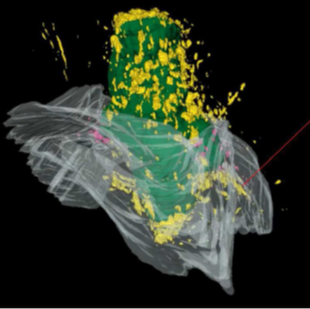
Figure 1. A high resolution image of a brain tumour inside a mouse. Green represents the core of the tumour, yellow represents dispersing cells and the grey cloudy region represents the interface between the white and grey matter. Reprinted from The American Association for Cancer Research: Burden-Gulley et al. (2011).
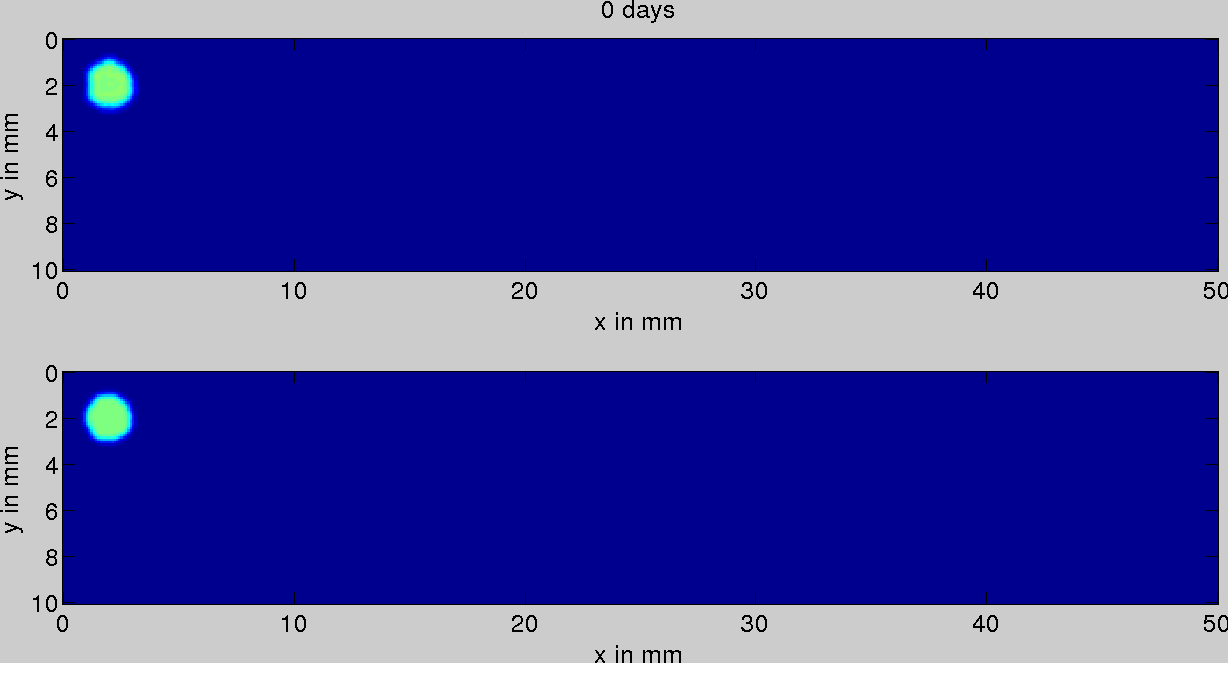
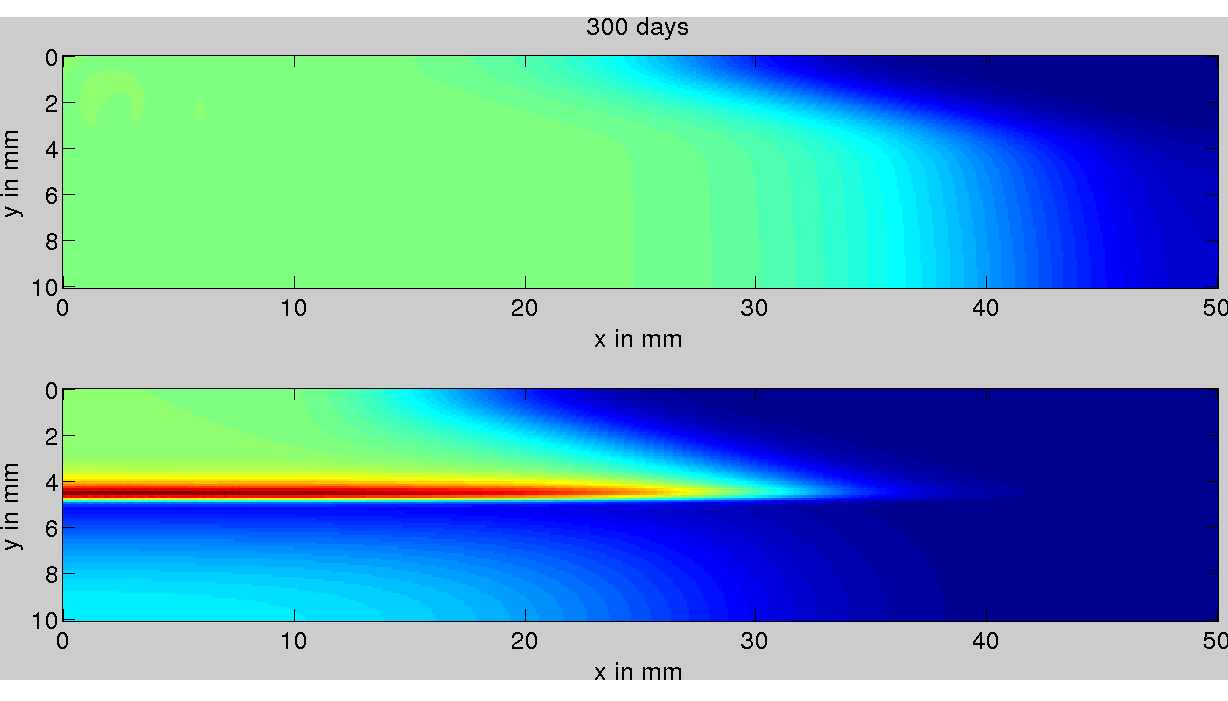
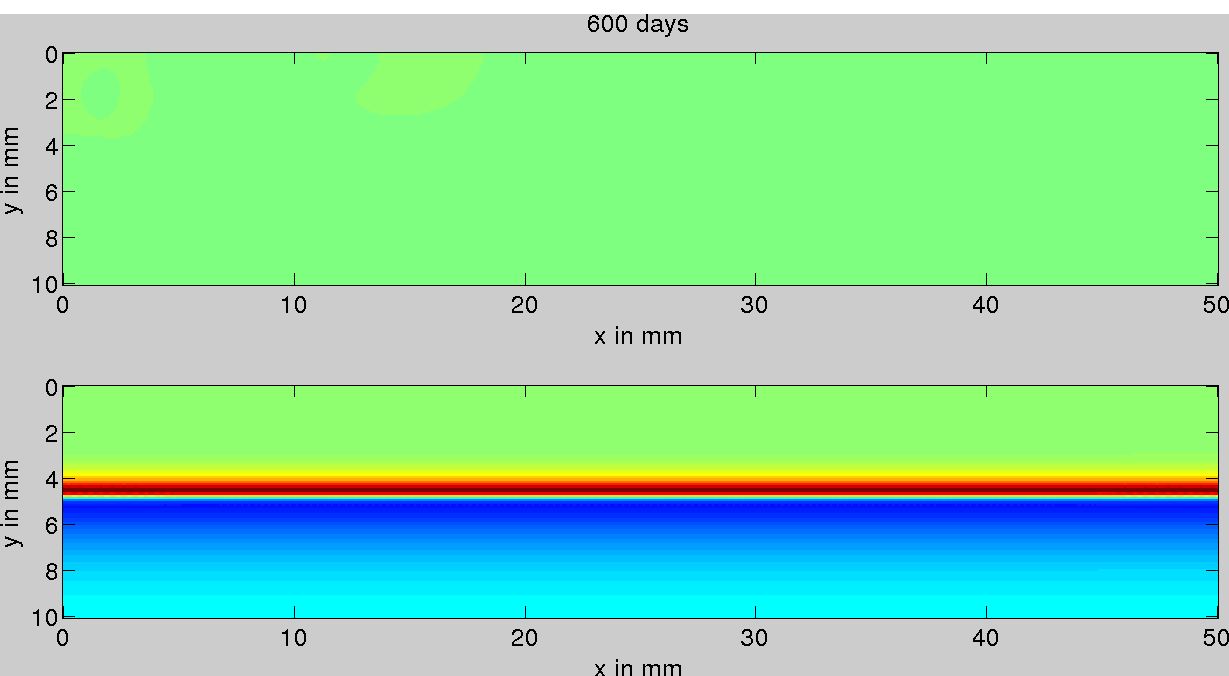
Figure 2. Three time points illustrating the spread of the tumour cells. Each time point illustrates the same domain, but with the cells using the two different sensing rules. Initially, at day 0 (top image), a small number of tumour cells are initiated at the top left corner of the domain, after 300 days (middle image) and 600 days (bottom image) we see the cells spread out over the domain. Each domain is split in half along the horizontal mid-axis. The top of the domain is taken to be white matter, the bottom is taken to be grey matter. In each pair of simulations the top simulation shows the current standard and, thus, the cells spread out uniformly leaving the domain all one colour by the end. The bottom simulation illustrates the new sensing rule and we see that a high density of cells (shown as a red colour) forms along the interface.