

Medicines are key to disease treatment but are not without risk. Some patients get untoward side effects, some get insufficient relief. The human genome project promises to revolutionise modern health-care. However, there are 3 billion places where a human’s DNA can be different. Just where are the genes of interest in sufferers of complex chronic conditions? Which genes are implicated the most in which disease in which patients? Which genes are involved in a beneficial response to a medicine? Which genes might be predictive of drug-induced adverse events? Collaborative industrial research by Oxford Mathematics' Clive Bowman seeks to tackle these areas to enable drug discovery companies to develop appropriate treatments.
The Royal Society Industrial Fellowship research at the Oxford Centre for Industrial and Applied Mathematics (OCIAM) extends stochastic insights from communication theory into producing easy-to-interpret visualisations for biotech use. Interacting determinants of the illnesses or adverse syndromes can be displayed as heatmaps or coded networks that highlight potential targets against which chemists can rationally design drugs. All types of measured data can be used simultaneously and dummy synthetic indicators such as pathways or other ontologies can be added for clarity. Heterogeneity is displayed automatically allowing understanding of why some people get a severe disease (or drug response) and others a mild syndrome, as well as other variations, for example due to someone’s ethnicity.
Helped by this mathematics the hope is that the right drug can be designed for the right patient and suffering alleviated efficiently with the minimum risk for the individual. For fuller detail on Clive's work please click here.
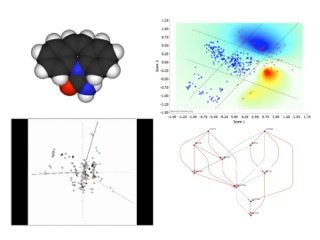
The image above shows a drug adverse event example (please click on the image). Clockwise from top left: Drug molecule (by Fvasconcellos); heat map showing patients with severe (red) or mild (blue) syndrome in multidimensional information space (courtesy of Dr O Delrieu); two aetiological subnetworks to syndrome; 3D animation display of results with dummy indicator variables.