


As you settle into your seat for a flight to a holiday destination or as part of yet another business trip, it is very easy to become absorbed by the glossy magazines or the novel you've been waiting forever to start reading. Understandably, the phrase "safety features on board this aircraft" triggers a rather unenthusiastic response. But you may be surprised by some of the incredible technology just a few feet away that is there to make sure everything goes smoothly.

Figure 1: Aircraft flying through high liquid water content environment. Custom-made watercolor painting by graphic designer Anca Pora.
On a cloudy or rainy day (of which there are no shortages here in the United Kingdom), airplanes have to navigate the local crowded airspace and fly through very humid conditions. Tiny drops of water hit the surface of the aircraft and start accumulating, forming thin liquid films and rivulets. Once a certain altitude is reached, temperatures fall sharply and these patches of water may quickly freeze and become a real danger. In fact, after human error and mechanical failure, weather-related incidents are next in line and icing is one of the main culprits. The build-up of ice can affect both flight efficiency (fuel economy) and safety, especially as it tends to form near wings and nacelles, where the engines are located. Right now, protocols are in place to divert energy from the engines and heat up specific problem regions and avoid potential issues. But this is a largely inefficient process and still very little is known about what the liquid on the surface actually does. In fact, even the brilliant engineers of fiction have given this some thought. In one of the action-packed scenes of the 2008 Iron Man movie, Tony Stark lures his metal-suited opponent high up into the atmosphere and triumphantly asks the frosted figure behind him: "How'd you solve the icing problem?" We're still working on it in the real world Tony.
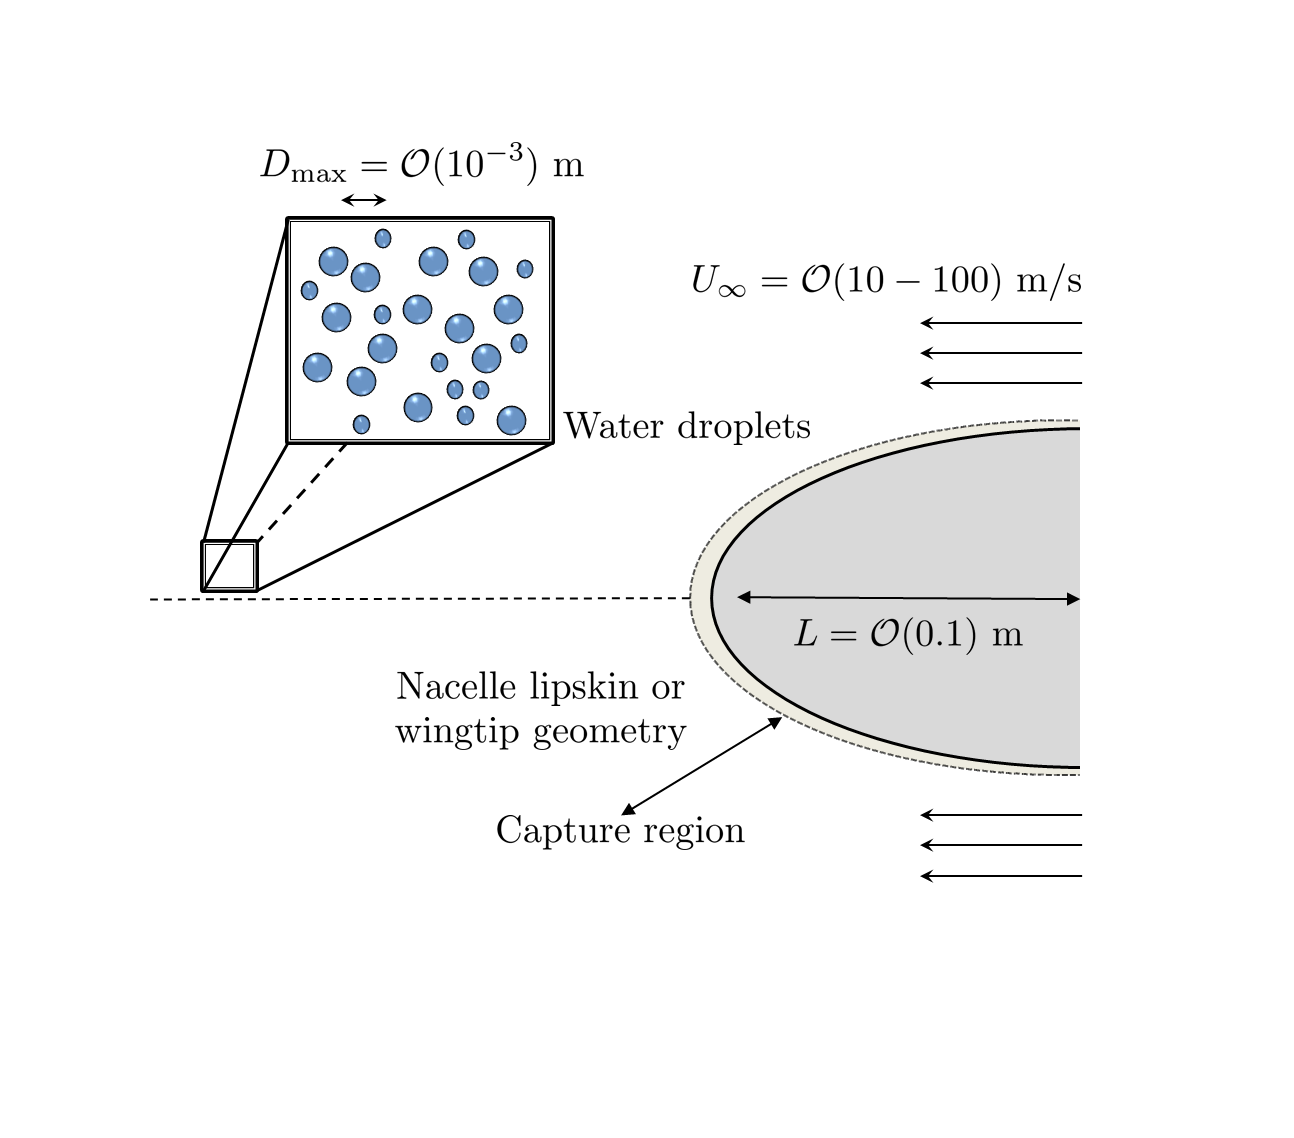
Figure 2: Schematic of a typical aircraft component such as a wingtip or nacelle lipskin interacting with liquid droplets in the atmosphere.
Attempting to understand the detailed effects in this scenario leads to what applied mathematicians call a multi-scale problem (see Figure 2 for a schematic). On the one hand one needs to model and account for the complex high speed air flow around specialised geometries (the aircraft itself or aircraft parts). On the other hand, one would like to investigate the detailed dynamics surrounding physical processes such as violent drop impact, with features changing at the sub-micron scale inside the capture region on the aircraft surface. Add to the above further multi-physics effects (such as temperature) and an incredibly rich and difficult landscape emerges, which cannot be dealt with by sheer brute force.
Presently most commercial software used by engineers focus on the larger of the two scales in order to include manufacturer-specific geometries, while the fluid mechanics of the splash itself is severely simplified. As outlined by Gent et al (2000), some of the key building blocks are to assume the drops themselves are solid, non-deformable spheres that do not affect the air flow and follow simple particle-based trajectory updates as a result of them being acted on by the air velocity. Consequently full coupling with the background air flow, drop deformation, collision, coalescence and microdrop ejection and dynamics are all typically neglected or empirically modelled, even in close vicinity to the surface. While this may be reasonable (up to a certain extent) for the very smallest of drops, it is no longer accurate for the larger supercooled droplets.
With regulatory agencies such as the EASA and FAA recently updating flight safety certification standards, the issue of liquid build-up leading to aircraft icing is currently at the forefront of aerospace research. The topic underpinned several work packages within the recently completed SANTANA Innovate UK grant, with Bombardier Aerospace UK Ltd. Belfast as lead industrial partner.
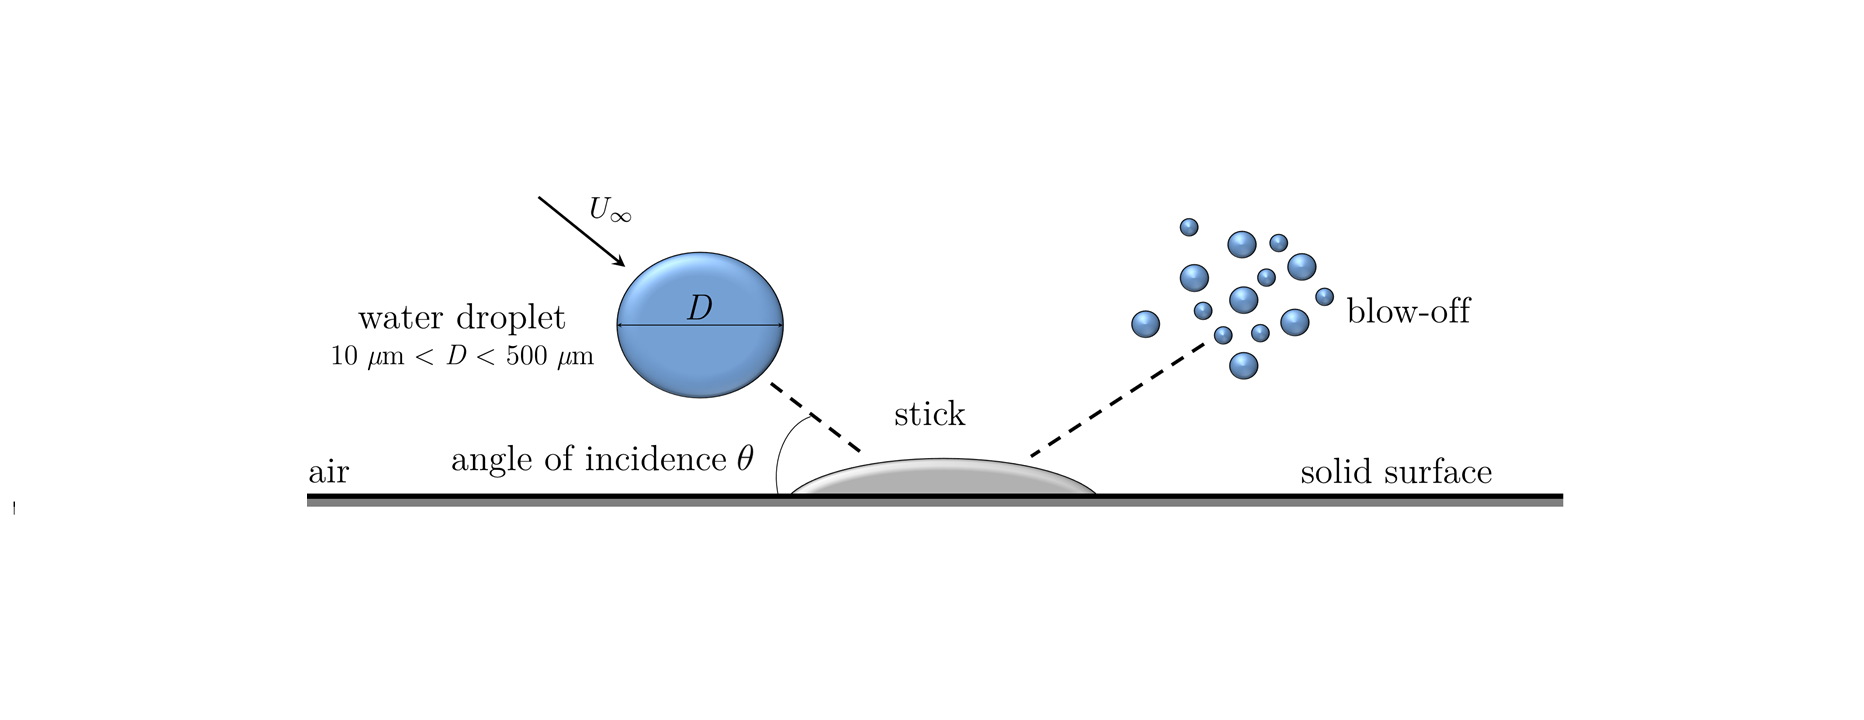
Figure 3: Geometry of interest for drop impact process, with drop velocity $U_\infty$, drop diameter $D$ and impingement angle $\theta$ as main parameters. Determining what proportion of the drop volume remains on the surface (stick) and how much is ejected away in the form of secondary microdroplets (blow-off) is a one of the key problems in improving water collection efficiency measures.
Oxford Mathematician Radu Cimpeanu together with collaborators from Imperial College London led by Demetrios Papageorgiou and engineers at Bombardier Aerospace have recently looked at the problem of drop impact onto aircraft surfaces from a different perspective.
First, the opportunity to take advantage of the disparity in lengthscales between the drops and the solids being impacted has been identified and the complex system was reduced to a canonical problem, illustrated in Figure3. Even in the worst case scenarios, the drops will meet what can be accurately approximated as flat surfaces. The drop size, velocities and impacting angle need to be taken into account, however locally the variations in the aircraft shape are not significant. Next, the air flow around the solid itself was accounted for using the framework of oblique stagnation-point flow. This analytically tractable flow model provides both a simple way of introducing the impact angle in a stable manner, while also producing the near surface boundary layer structures which are known to occur at these large speeds. The timescale of the event (just a few hundredths of a second) allowed further simplifications and ultimately enabled the researchers to focus on the detailed process of the impact itself in the target conditions, without introducing artificial restrictions.
The resulting model accounts for the full coupling between the air and the liquid, solving the Navier-Stokes equations (the partial differential equations governing the motion of fluids) using state-of-the-art computational tools that capture the physics behind violent dynamics in detail as opposed to resorting to the traditional parameter fitting exercises. This was only possible by reducing the problem to a smaller, more approachable setting. Even so, large scale high performance computing facilities were required to elucidate the flow characteristics, with tens of thousands of CPU hours needed to span the parameter space of interest and link the setup to the few experimental studies of this scenario, e.g. Papadakis et al. (2004), NASA.
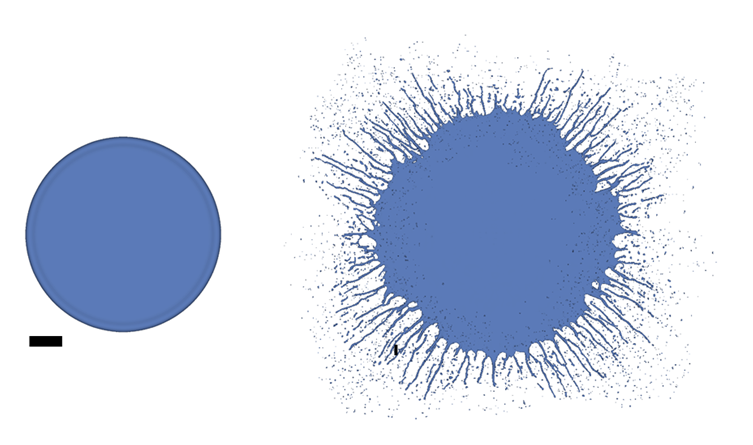
Figure 4: Top view of a small $D=200\ \mu$m drop (left) and a relatively large $D=200\ \mu$m drop (right) after having impacted the solid surface at an angle of $\theta = 90^{\circ}$.
The main findings may be analysed by considering three distinct stages:
1. Pre-impact: As the drops approach the surface, the transition from spherical to ellipsoidal drop shapes and eventual break-up was observed, quantified and compared to the experimental setup of Sor and Garcia-Magarino (2015). Early on in the deformation process the good qualitative and quantitative agreement between experiment and model was confirmed, while later on the computational platform allowed closer inspection and quantitative understanding of the disintegrating drop beyond the capabilities of the laboratory imaging equipment.
2. Impact: To gain insight into the immediate aftermath of the impact itself, together with Dr. Matthew Moore (previously Imperial College London, now Oxford Mathematics), techniques involving complex and matched asymptotic analysis have been employed in a similar large velocity context to study the formation of the high speed jet resulting from the splash and its properties, which underlie the subsequent drop formation and ejection.
3. Post-impact: The microdrops resulting from the violent splash would be very difficult to visualise experimentally due to the limited resources of even the most modern laboratories, let alone in the noisy environment of a real flight data collection exercise. Purely analytically this is also intractable, primarily due to the subtleties surrounding the continuous topological changes (rupture of the main drop into multiple small drops) in the flow. However the developed numerical approach comes to the rescue and allows the extraction of interesting dynamics transitioning from the neat spreading (or pancaking) motion of small drops to the violent splash of large drops, as shown in Figure 4. Finally spatio-temporal maps of the secondary drop movement are provided and quantities such as secondary drop volume distributions (with an example illustrated in Figure 5) or surface areas which characterise the regions susceptible to freezing may be calculated.
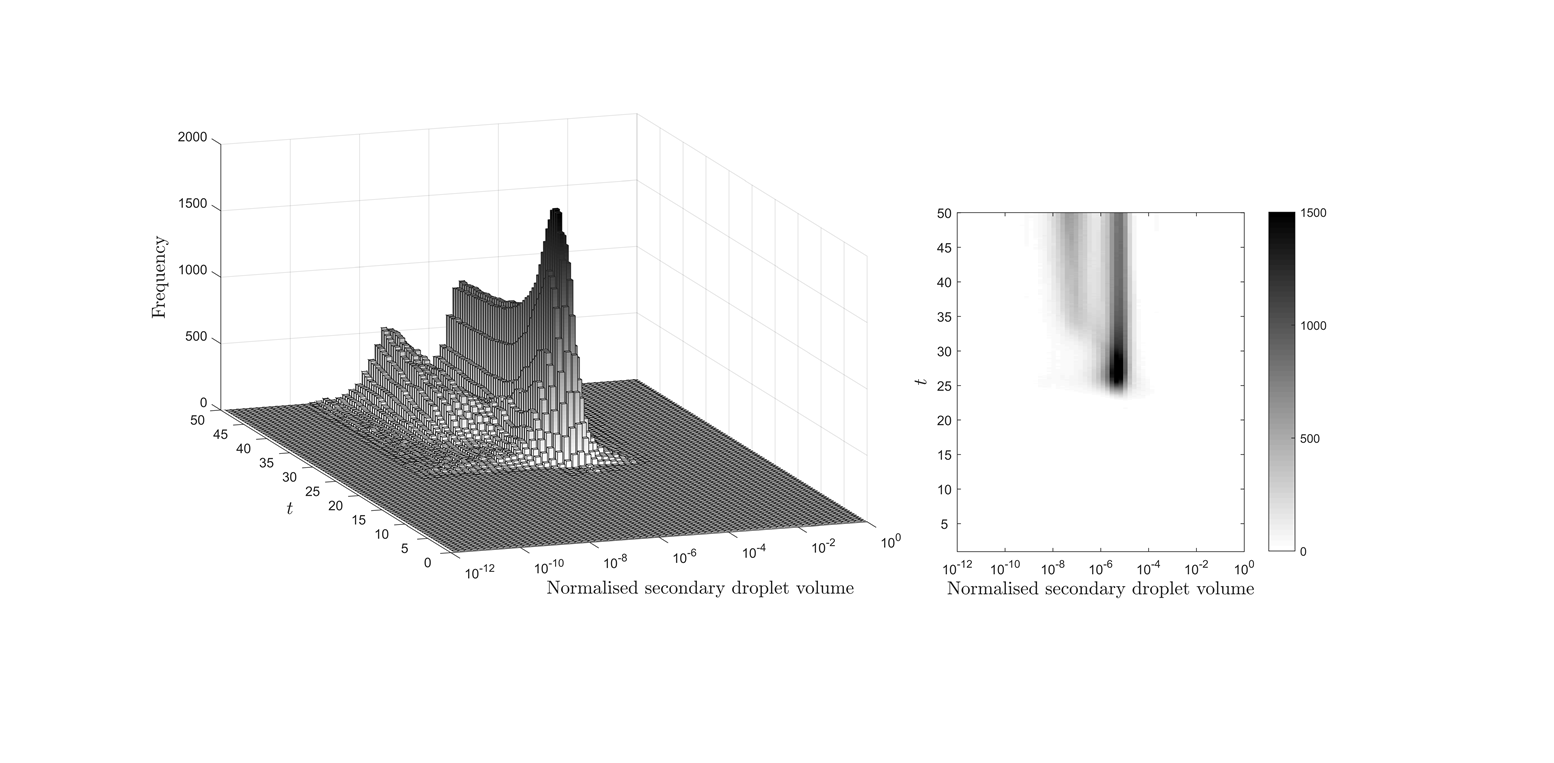
Figure 5: Secondary drop size distribution as a function of time for a relatively large $D \approx 200\ \mu$m drop impinging onto a solid surface at $\theta = 90^{\circ}$. An initially log-normal distribution develops a secondary local maximum as a result of the secondary drop dynamics (movement, break-up, coalescence) after the impact. Reproduced from Cimpeanu and Papageorgiou (2018).
Through this work, the researchers described fluid dynamical processes beyond the reach of previous simplified models, taking into account significantly more of the underlying physics. The first stages of the investigation have recently been published, with several extensions currently ongoing. The multi-scale coupling means that the proposed methodology can be embedded into the design pipeline for a large range of flow conditions and/or aircraft prototypes, with the challenging effects shifted to the local splashing problem and the behaviour being transmitted back to the larger scale seamlessly and flexibly.
The presented drop impact model addresses key questions at a fundamental level. However, the conclusions of the study extend towards the advancement of understanding of liquid dynamics on aircraft surfaces in a practical manner. It potentially leads to improvements in anti-icing techniques, which have important implications for aircraft safety at a time when both the numbers and types of machines flying up above are expanding at an unprecedented rate.