Over the last five decades, software and computation has grown to become integral to the scientific process, for both theory and experimentation. A recent survey of RCUK-funded research being undertaken in 15 Russell Group universities found that 92% of researchers used research software, 67% reported that it was fundamental to their research, and 56% said they developed their own software. As well as the practical use of performing numerical calculations impossible to produce by hand, software is vital for the communication of ideas and methods between scientific disciplines and for knowledge transfer to industry. While traditional scholarly publication can communicate the context, benefits and limitations of a given numerical method, the mathematical and computational details of implementation are often beyond non-specialised users, and software provides a formal language for encoding these ideas in such a way that they can be put to use immediately by potential users.
Biology is one of the many fields that increasingly uses software to inform and test new hypotheses. At smaller length-scales, molecular dynamics is used to model biomolecules to learn more about the structure and functional behaviour. For larger systems, coarse-graining is used to model whole molecules as single particles to study the emergent behaviour of chemical pathways at a sub-cellular level. For whole organs, differential equations are used to model the same pathways taking into account tissue mechanics and structure.
In order to support the wide variety of numerical methods used in biology, Oxford Mathematics researchers Martin Robinson and Maria Bruna have developed Aboria, a high performance software library for particle-based methods. In general, particle-based methods involve the calculation of interactions between particles in dimensional space, where the particles can describe either physical particles (e.g. molecular dynamics), a set of discretization points for solving differential equations (e.g. radial basis functions), or high dimensional data points (e.g. kernel methods in machine learning). Traditional particle-based methods such as molecular dynamics are enabled by complex, highly specialised software packages that are costly to develop and maintain. Within biology in particular, individual particle-based methods often require the development of custom particle interactions that are developed from scratch for each new project, making such high specialised packages unsuitable. Instead, Aboria provides an efficient and easy to use abstraction for the evaluation of both local and long range interactions, while at the same time allowing users to completely specify the nature of the both the particle interactions and how they are integrated over time.
Aboria has previously been used to simulate interacting elliptical particles in a molecular-scale liquid crystal model, diffusion through random porous media, and Brownian particles interacting via soft-sphere potentials. We are currently collaborating with Dyson and Ian Griffiths in Oxford to use Aboria to model how solid particles flow through a filter, and where they are trapped by the filter fibres. For this latter case Aboria is used to not only to evaluate the short-range interactions of particles with the fibres, but also to solve the fluid flow around the fibres, and the long-range electrostatic interactions of the system.
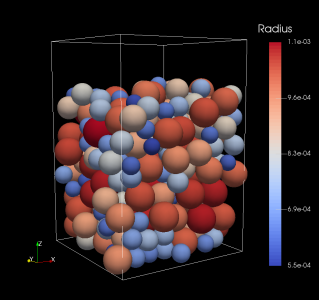
The main image shows a packing of polydisperse spheres using Aboria, where each sphere interacts with the others using a repulsive linear spring force. Each sphere is coloured by its radius.
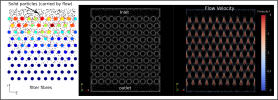
The image below shows Filter simulation using Aboria. (Left) shows the solid particles in black that move with the flow and diffuse independently. The large coloured circles are the fibres of the filter that capture the solid particles (coloured by number of captured particles). The small red particles show where the solid particles were captured. (Middle) shows computational nodes where fluid flow is calculated, showing the flow inlet at the top, and the outlet at the bottom. (Right) plots the fluid flow at each of the nodes, coloured by velocity magnitude.