Oxford Mathematician Paul Moore talks about his application of mathematical tools to identify who will be affected with Alzheimer's.
"Alzheimer's disease is a brain disorder which progressively affects cognition and results in an impairment in the ability to perform daily activities. It is the most common form of dementia in older people affecting about 6% of the population aged over 65 and it increases in incidence with age. The initial stage of Alzheimer's disease is characterised by memory loss, and this is the usual presenting symptom.
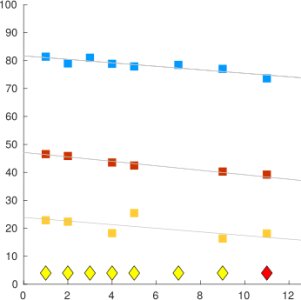
Psychiatrists would like to predict which individuals will develop the condition both for selecting participants for clinical trials and for finding which variables are used in prediction because this gives insights into the disease process. These variables might be individual characteristics such as age and genetic status or the results of brain scans and cognitive tests. The graph shows some time plots of scaled brain volumes from successive MRI scans of an individual who has Alzheimer's disease. The whole brain volume is shown as the blue markers, the hippocampus is marked in red and the entorhinus in yellow. The diamonds at the foot of the graph represent diagnosis points where the red diamonds are a diagnosis of Alzheimer's disease. The trend in time seems to be downwards, but this feature might also be found in many healthy people as they age. So our research question is: can we distinguish the changes of relative brain volumes in people who are healthy from those who will subsequently be diagnosed with Alzheimer's disease?
One possibility is to put the data points directly into a deep learning method like a neural network. This approach might give accurate predictions, but it would not be easy to see which variables are important and how they change with respect to each other. The method we use is to think of the way the variables change against each other over time as a path in Euclidean space and to characterise that path as a vector which uniquely identifies it. This path signature was introduced by K.T.Chen in 1958 and has recently proved to be highly successful in machine learning applications. It generates interpretable features and it can distinguish the time ordering of events: whether variable a or variable b changes value first. Our results show that the hippocampus is shrinking abnormally fast in people who are subsequently diagnosed with Alzheimer’s disease - a finding that is already known from clinical research. We are now expanding the number of brain regions that we investigate to improve the accuracy of our models and to learn more about the underlying process of this deadly disease."