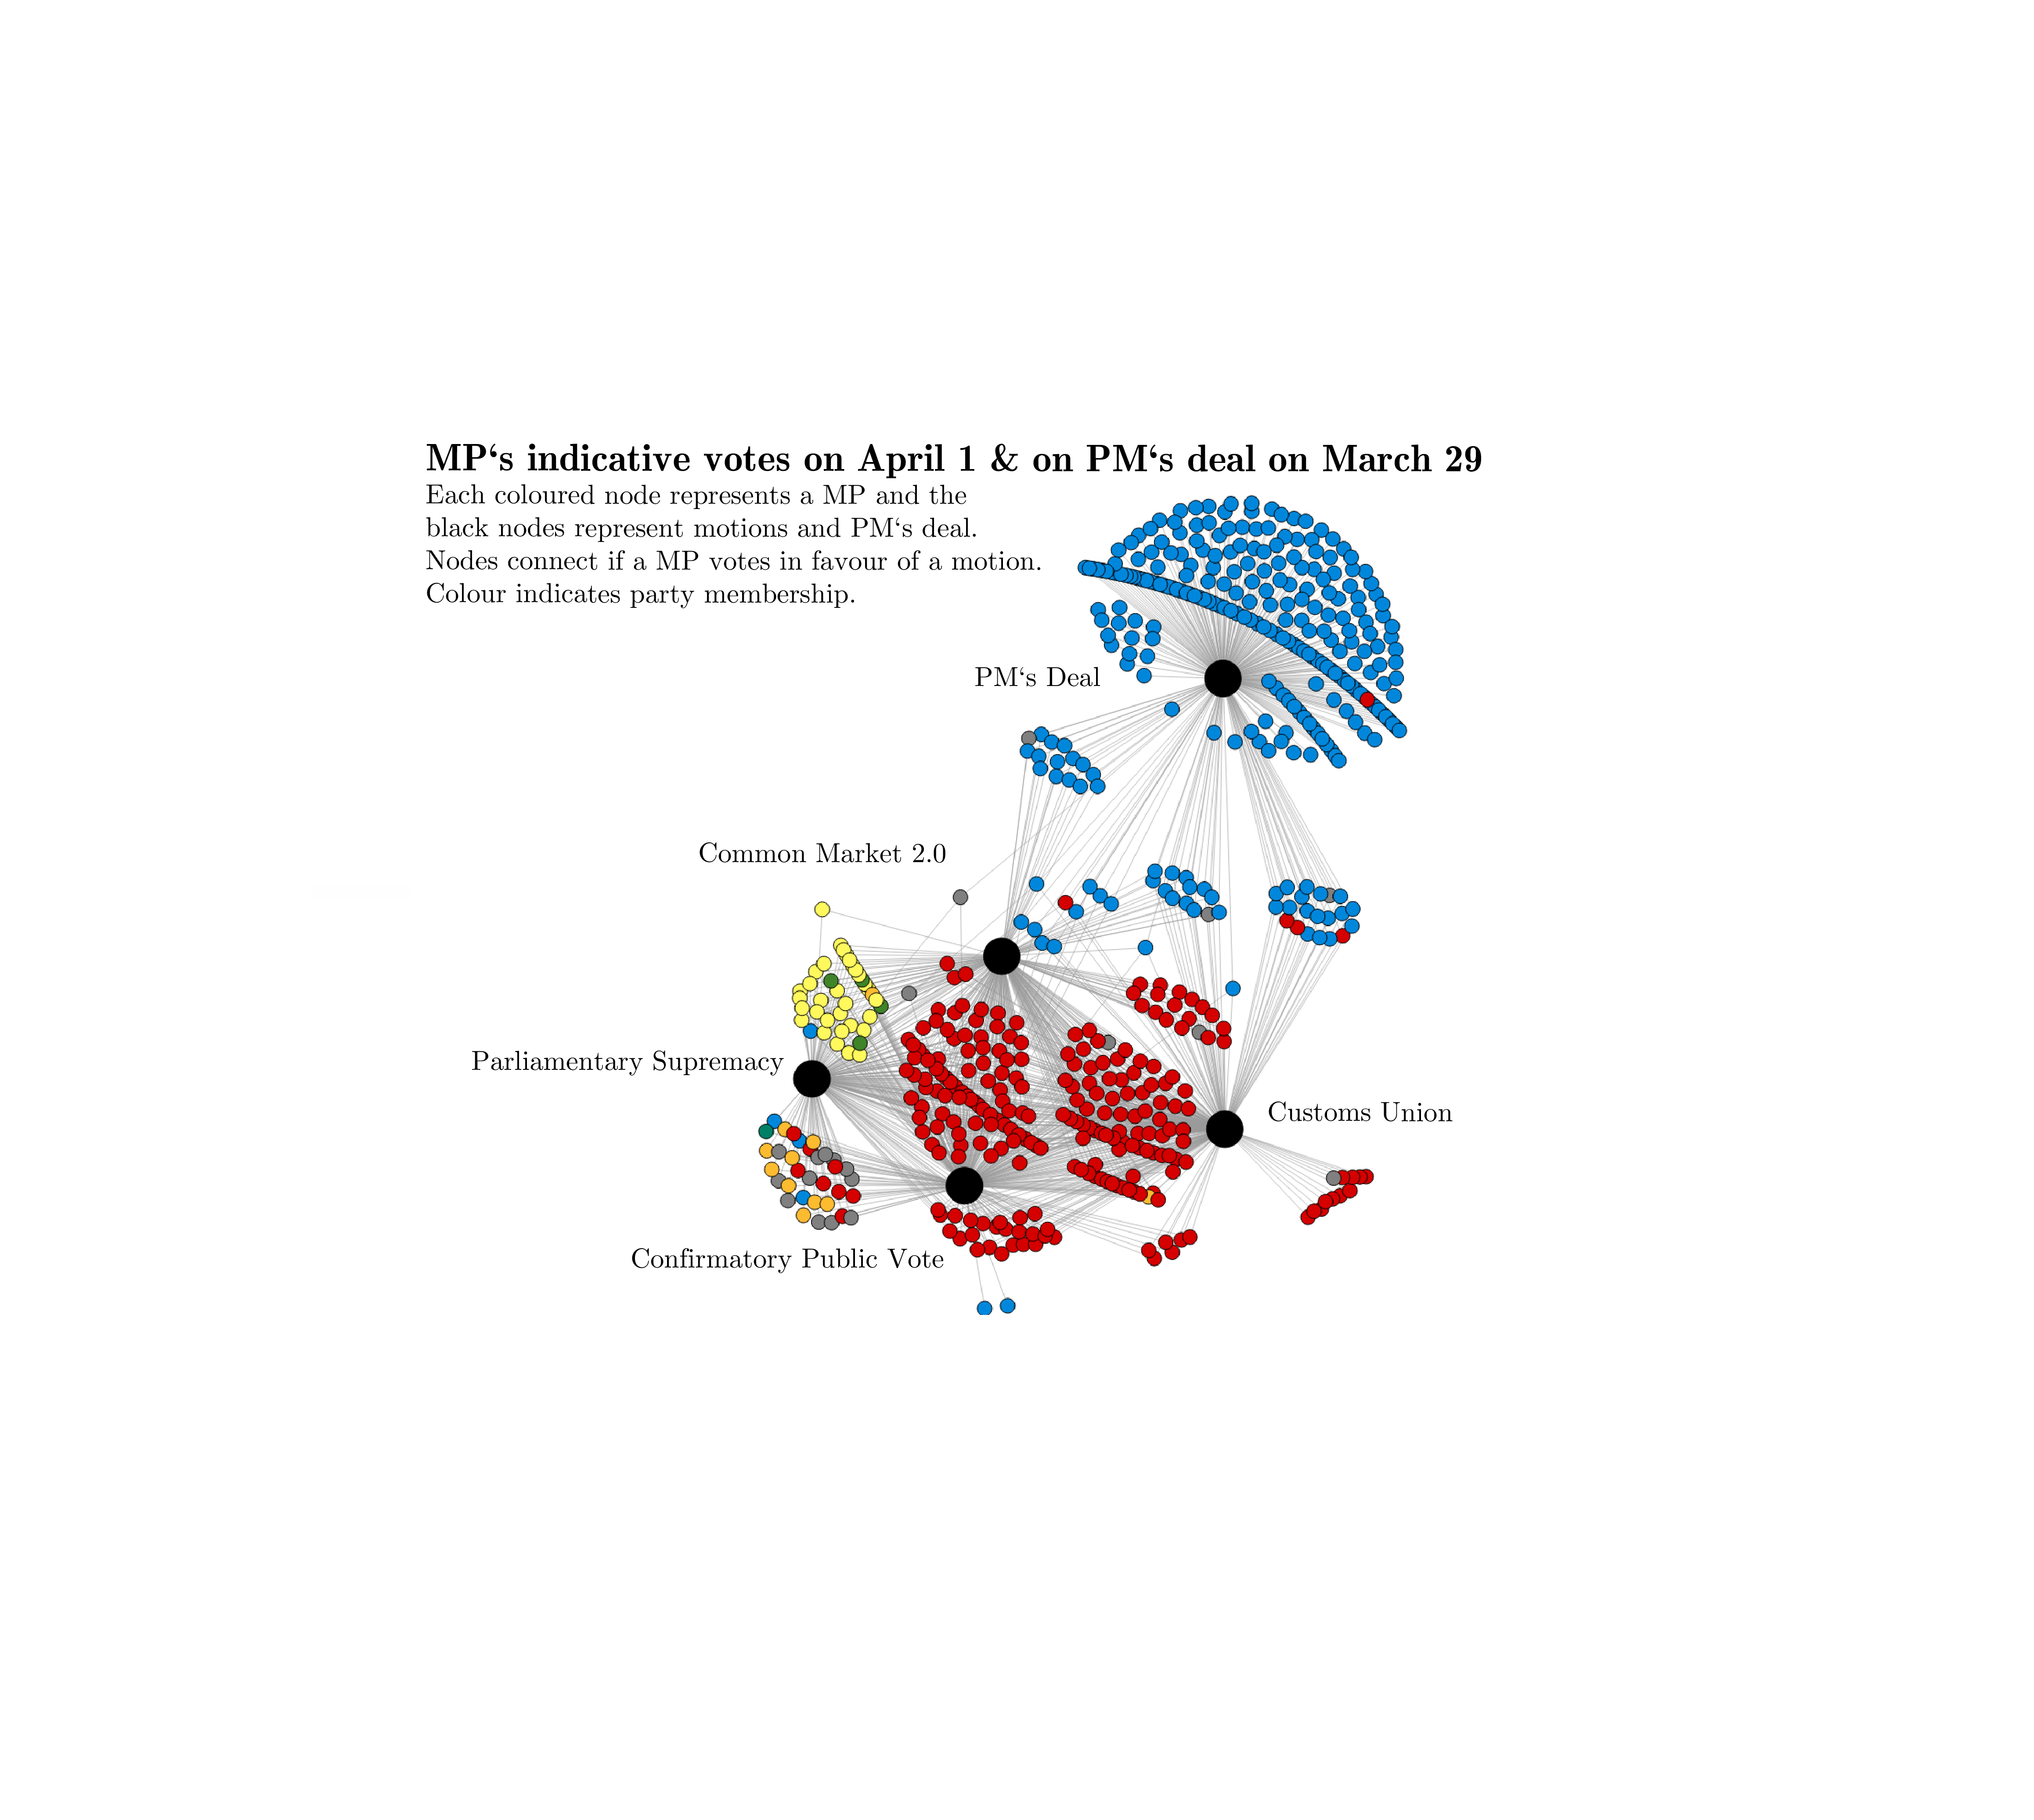
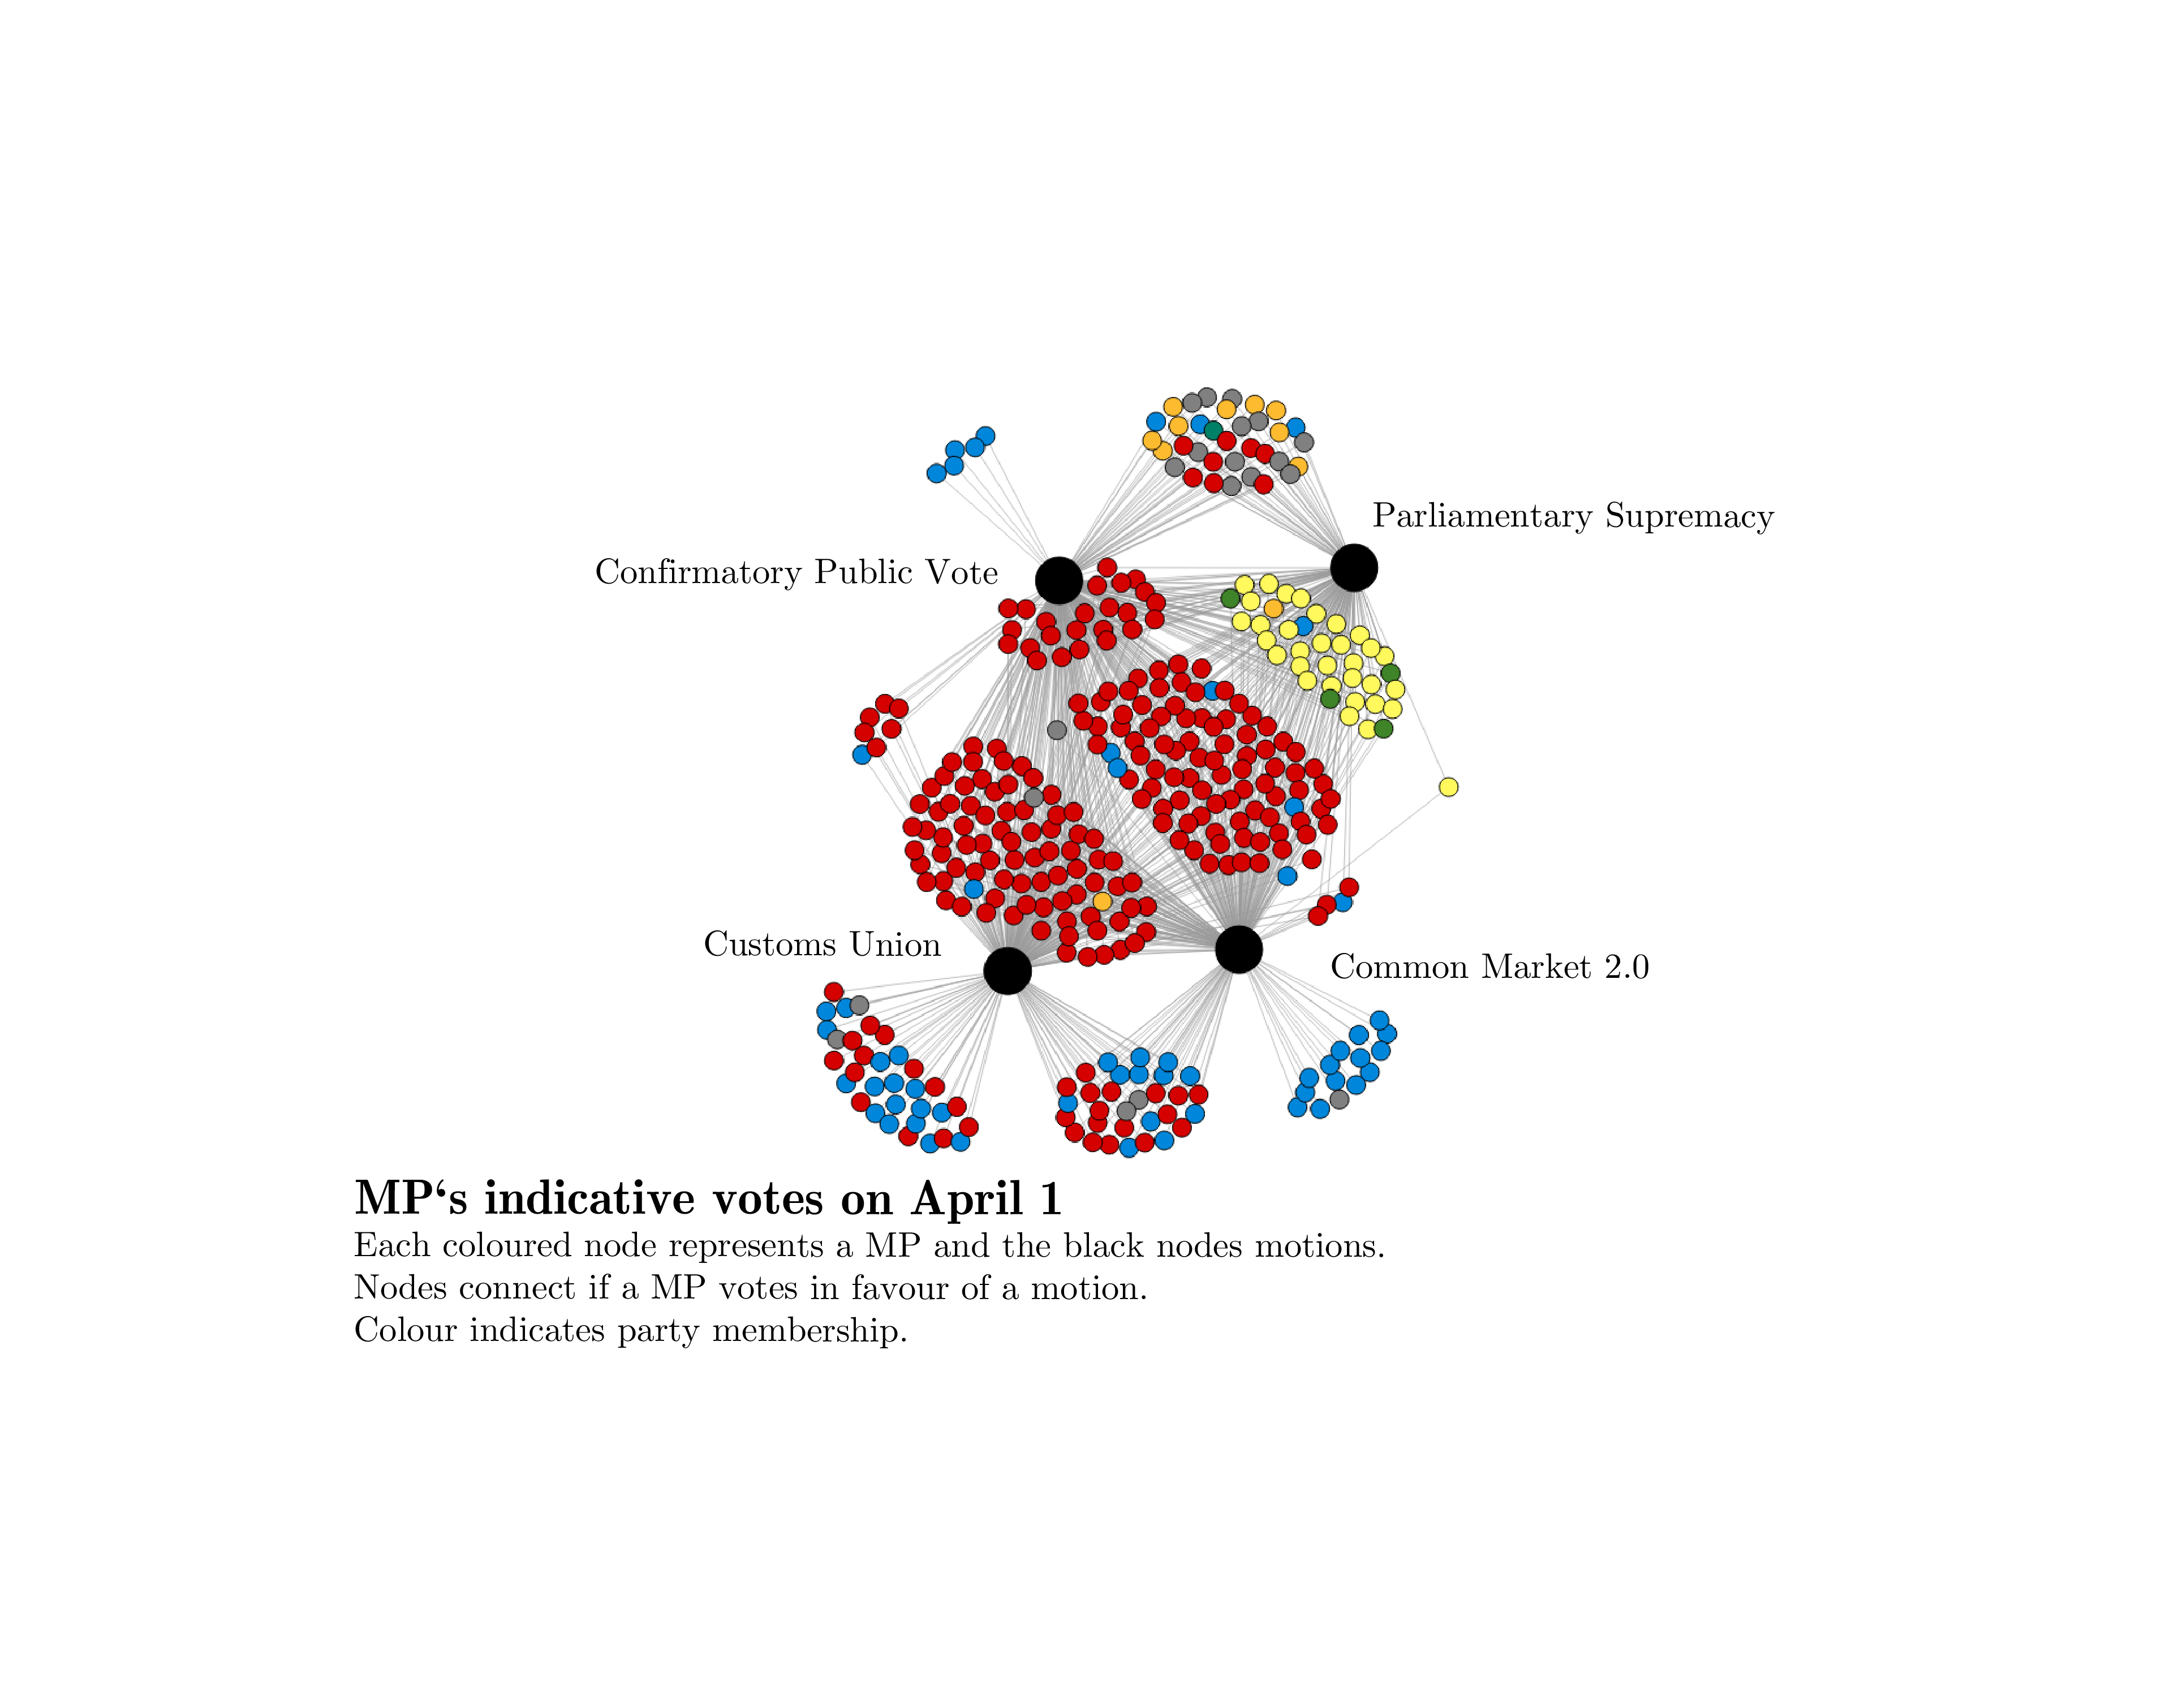
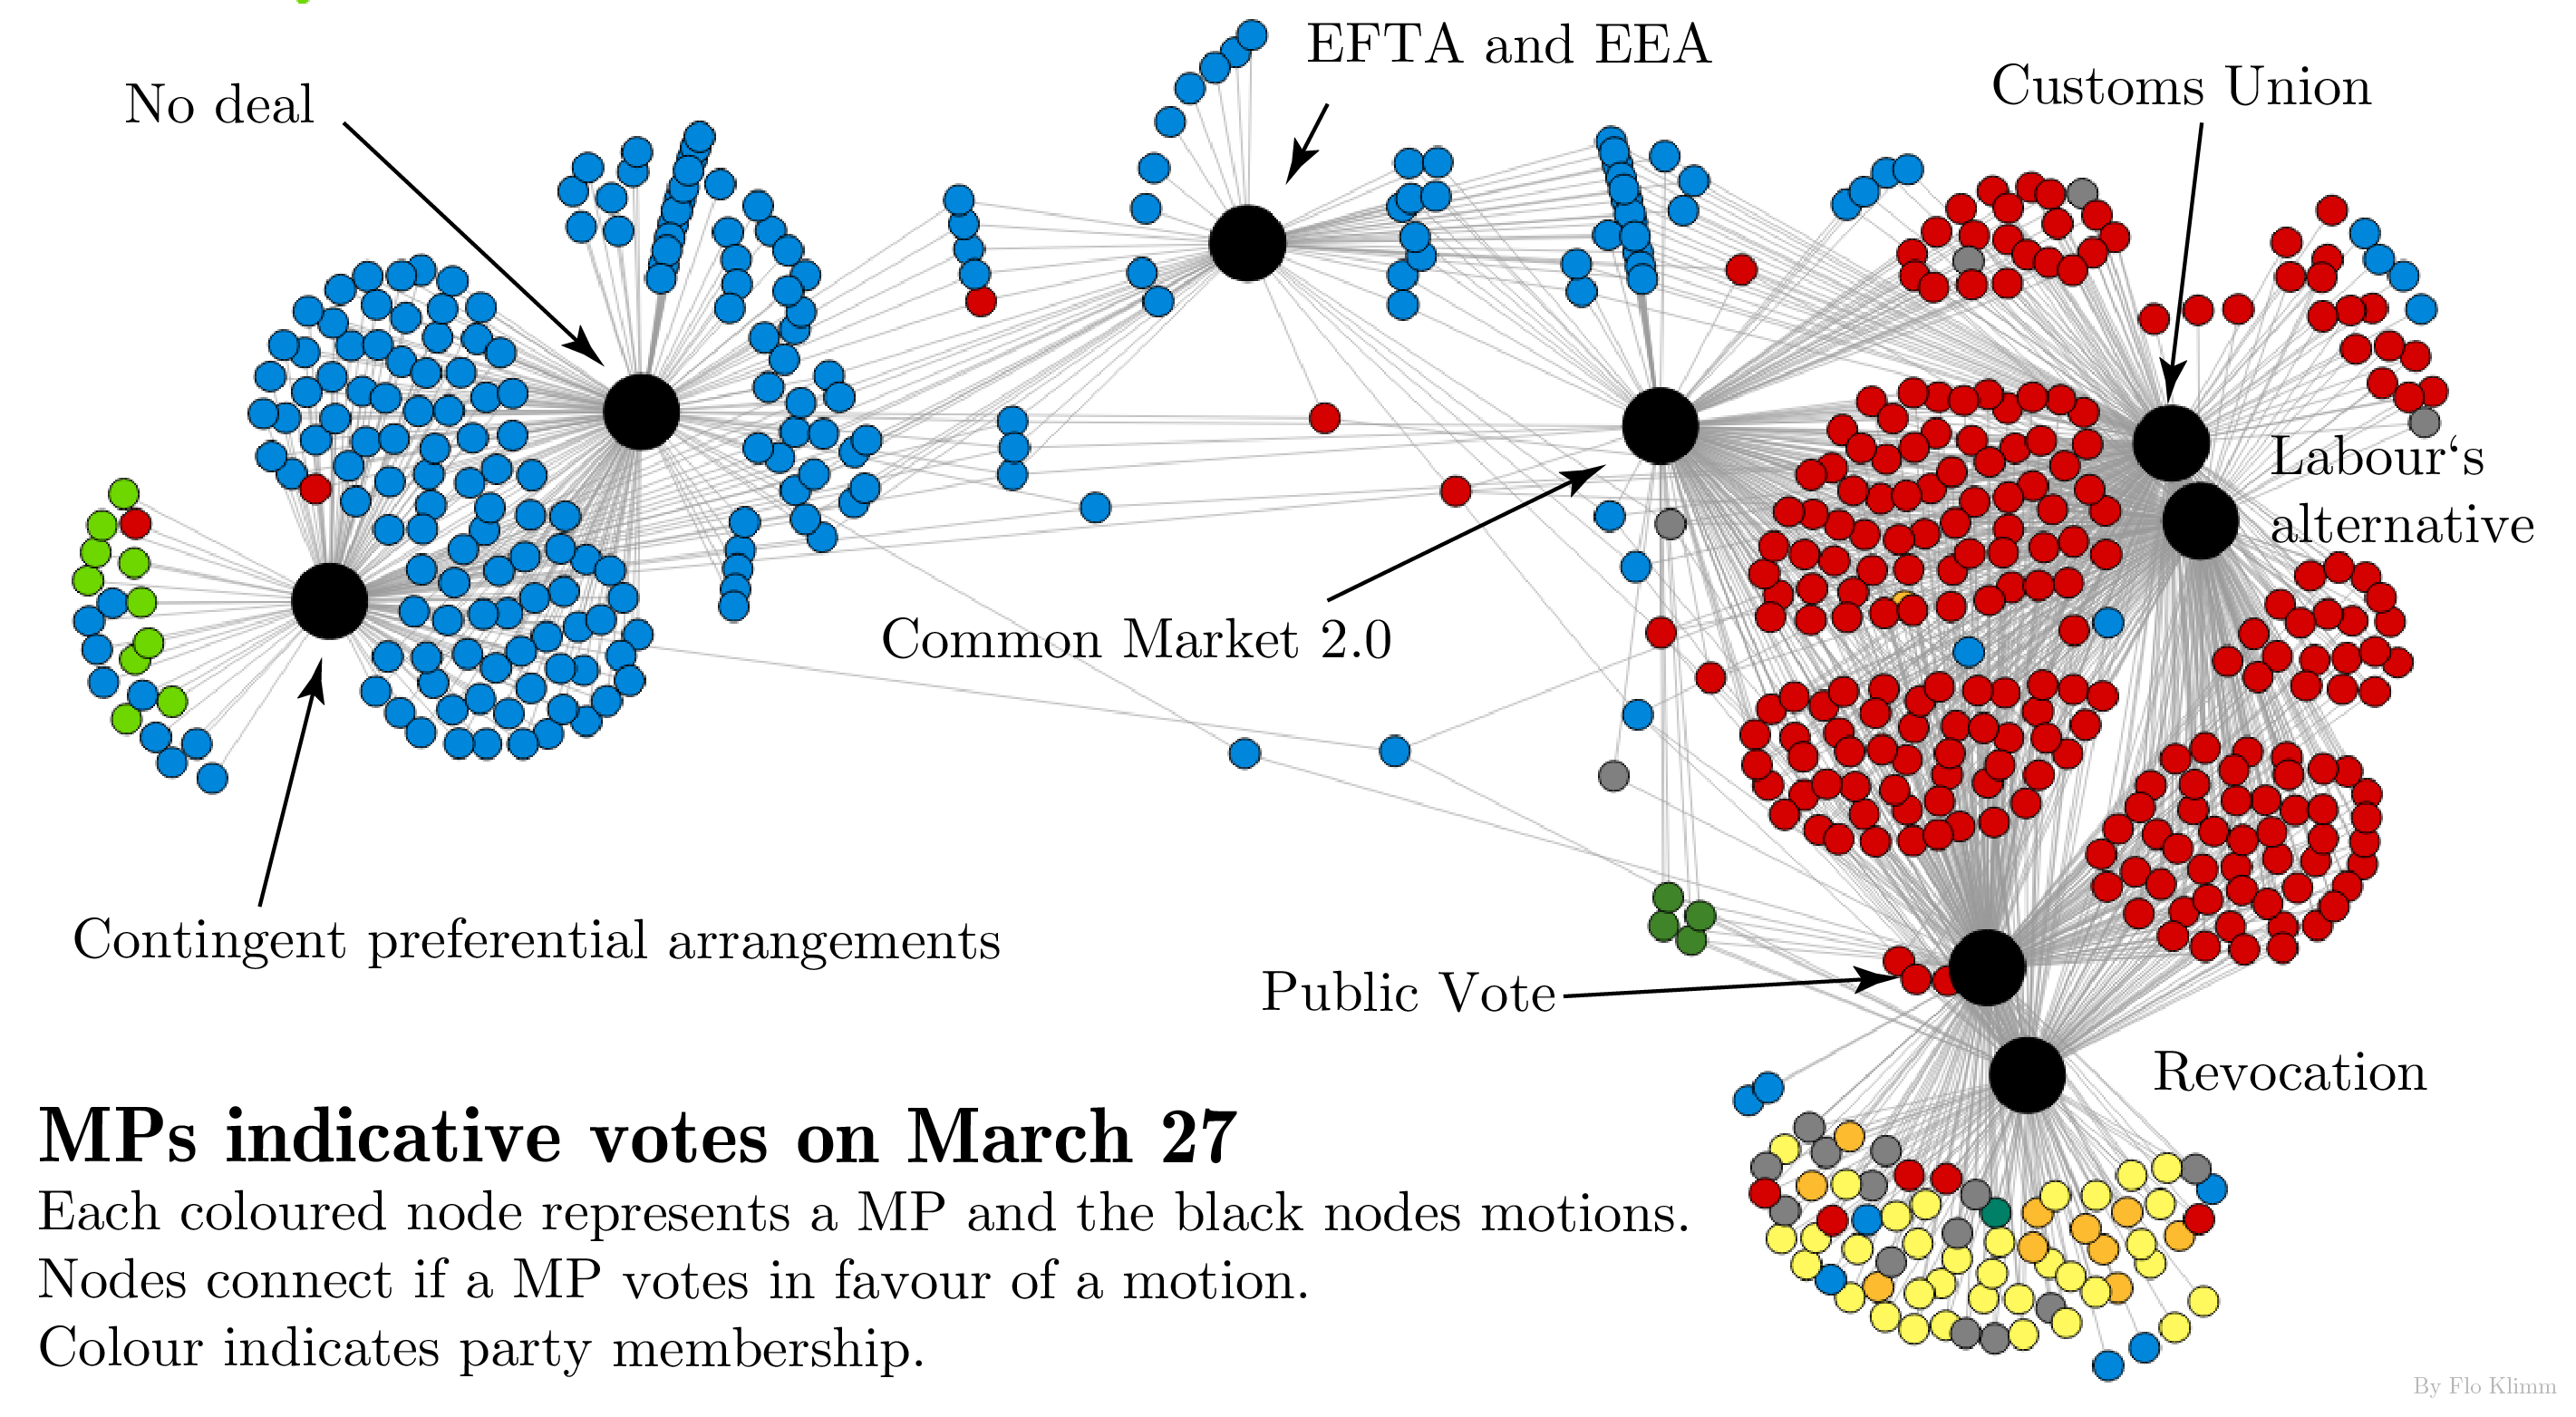
The recent votes in the House of Commons on Brexit are a type of high-dimensional data which is hard to understand, as each MP votes on several motions. Oxford Statistician and Mathematician Florian Klimm has illustrated such data as 'bipartite networks’, in which nodes represent either MPs or motions which are connected if an MP voted in favour of a motion. In this layout, MPs that voted similarly are close together. We can also explore how single MPs voted and how parties are divided or unified. We also see that motions that have the support of a similar set of MPs are close by each other.
For many research projects in applied mathematics and statistics, such visualisations are a first step to understanding complex data and forming working hypotheses. On a larger temporal scale, for example, we can investigate how political voting networks change over time, as this study on the U.S. Senate demonstrates.
Please click on the images to enlarge and click here for the interactive version.