
Alois Alzheimer called Alzheimer's disease (AD) the disease of forgetfulness in a 1906 lecture that would later mark its discovery. Alzheimer noticed the presence of aggregated protein plaques, made up of misfolded variants of amyloid-beta (A$\beta$) and tau ($\tau$P) proteins, in the brain of one of his patients. These plaques are thought to be the drivers of the overall cognitive decline that is observed in AD. AD is now one of the leading causes of death in many developed countries, including the United Kingdom.
The (A$\beta$) and ($\tau$P) proteins occur naturally in the brain but not in an aggregated state. It is now thought that a prion-like mechanism, a process similar to prion diseases [4], lies at the heart of this pathology [1,2]. The prion process can be summarized in two steps. First, a misfolded seed protein joins with a nearby healthy one. The misfolded protein 'transmits' its toxic misfolded state to the healthy protein. The pair then break apart into two separate toxic, misfolded seeds. The prion mechanism can be modelled with a few simple equations.
A few more salient things are at play in the brain that we will want to include in our simplified model. For one, healthy proteins are constantly being produced, and removed, in the brain. In addition, misfolded proteins do occur naturally but the brain has several means of removing them. If we ignore the complexities of brain facilities management, we can write down a simple model of organ-wide proteostasis that reflects these basic mechanisms of AD.
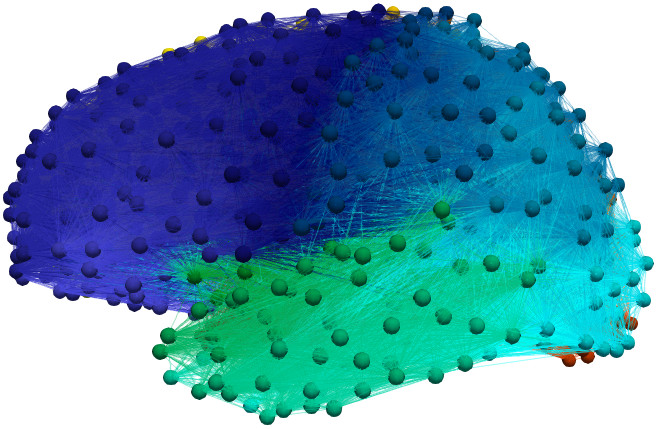
Figure 1: A composite brain graph constructed from the data of 492 patients
Suppose that the brain is a domain $\Omega$ and that $u$ and $\tilde{u}$ are healthy and toxic (misfolded) protein concentrations, respectively. The basic AD model is then \begin{align}\label{eqn:hxdimer-base} \dot{u} &= a_0 - a_1 u - a_{2}u\tilde{u},\\ \dot{\tilde{u}} &= -\tilde{a}_1 \tilde{u} + a_{2}u\tilde{u}, \end{align} where $a_0$ is the healthy production rate, $a_1$ and $\tilde{a}_1$ are rates of healthy and toxic protein removal and $a_{2}$ is the rate that toxic proteins recruit healthy proteins into the toxic state. As $a_0$, $a_1$, $a_2$ and $\tilde{a}_1$ correspond to physical systems, they take on positive values. The dynamics of this system are simple but biologically insightful. First, there are two stationary states \[ \left(u_1, \tilde{u}_1\right) = \left(\frac{a_0}{a_1}, 0\right)\quad\text{and}\quad \left(u_2, \tilde{u}_2\right) = \left(\frac{\tilde{a}_1}{a_{2}}, \frac{a_0a_{2} - a_1\tilde{a}_1}{\tilde{a}_1 a_{2}}\right). \]
Biologically, the first state, $(u_1,\tilde{u}_1)$, describes the presence of healthy protein and the absence of the toxic variant. This is the healthy brain that we enjoy the benefits of for most of our lives. The second stationary state represents the presence of a toxic protein infection and, in our current context, is the AD brain. What does our model say about our brain's health? The eigenvalues of the Jacobian, of the system above, for the healthy brain are \[ \lambda_1 = -a_1\quad\text{and}\quad \lambda_2 = \frac{a_{2}a_0 - \tilde{a}_1 a_1}{a_1}. \]
These eigenvalues mean that our healthy brain stays healthy only if\begin{equation}\label{eqn:clearance-ineq} a_{2}a_0 < \tilde{a}_1 a_1. \end{equation} The inequality above says, loosely, that when protein production rates are controlled by the clearance rates then the brain is safe from AD. Our model suggests that the clearance systems of the brain may play a special role in AD. In fact, it turns out that this is a non-trivial, but well-studied, clinical observation [3,5]. This is a good indication that our models are on the right track and can be extended to include more complex effects.

Figure 2; AD progression for a simulated patient. Toxic (A$\beta$) protein (left) and ($\tau$P) protein (right)
Until this point, we have looked at the brain as a single domain. However, we know from postmortem studies that the toxic protein infection starts in one brain region and then spreads. In fact, clinical experiments suggest [2] that proteins move around the brain using the fibrous bundles of the brain's axonal connections. Let us consider the individual cortical and subcortical regions of the brain as separate domains, $\Omega_i$. We can think of the brain as a very large graph where the vertices are the $\Omega_i$ and the edges represent the axons connecting the regions. Figure 1 shows a graph, with 1,015 vertices and 70,892 edges, constructed from the neuroimaging data of 492 patients. The final piece of the puzzle comes from the observation that the axonal connections are the dominant means of protein traffic, from region to region, in the brain. Our initial, static, model can be augmented with transport dynamics. Let $u_i$ and $\tilde{u}_i$ denote the healthy and toxic concentrations in $\Omega_i$. A Laplacian matrix, $\mathbf{L} = L_{ij}$, introduces transport along the axons as \begin{align}\label{eqn:hxdimer-base:diffusion} \dot{u}_i &= -\rho_u \sum_{j=1}^{N} L_{ij} u_{ij} + a_0 - a_1 u_i - a_{2}u_i\tilde{u}_i,\\ \dot{\tilde{u}}_i &= -\rho_{\tilde{u}}\sum_{j=1}^{N} L_{ij}\tilde{u}_{ij} -\tilde{a}_1 \tilde{u}_i + a_{2}u_i\tilde{u}_i. \end{align}
Models like the one above are the basic starting point for further studying AD dynamics. Extensions of this simple model have already been used to test whether AD mechanisms, observed in mice, might also play a role in humans. For instance, interactions between (A$\beta$) and ($\tau$P) in AD are thought to be critical for understanding the death of neurons and the development of atrophy. Modeling suggests [6] that these interactions may indeed be central to disease progression in humans and that interacting models can explain patient neuroimaging data.
Our simple model suggested to us that the brain's clearance systems played a specific role in protecting us from AD. In fact, more elaborate modeling can show [7] how the brain's clearance systems fight back against the toxic seed proteins as they try to aggregate to form the plaques that Alzheimer first observed. Mathematical models of AD also afford us the ability to use statistical techniques to obtain personalized, predictive simulations from patient data. Figure 2 shows the toxic (A$\beta$) and ($\tau$P) distribution for a simulated AD patient.
Oxford Mathematics is taking a stand against AD by using mechanistic models and scientific computing to bring a personalized, predictive clinical understanding of the disease to the UK. That's something you can't forget.
Travis Thompson is a Postdoctoral Research Associate at the Mathematical Institute in Oxford.
References
[1] Michel Goedert. Alzheimer’s and Parkinson’s diseases: The prion concept in relation to assembled aβ, tau, and α-synuclein. Science, 349(6248):1255555, 2015.
[2] G. Hallinan, M. Vargas-Caballero, J. West, and K. Deinhardt. Tau misfolding efficiently propagates between individual intact hippocampal neurons. J. Neurosci., 2019.
[3] M. Nedergaard and S. Goldman. Glymphatic failure as a final common pathway to dementia. Science, 370(6512):50–56, 2020.
[4] Stanley B Prusiner. Prions. Proceedings of the National Academy of Sciences, 95(23):13363– 13383, 1998.
[5] Jenna Tarasoff-Conway, Roxana Carare, and Mony J. de Leon et al. Clearance systems in the brain–implications for Alzheimer disease. Nat Rev Neurol, 11(8):457–470, 2015.
[6] T.B. Thompson, P. Chaggar, E. Kuhl, and A. Goriely. Protein-protein interactions in neurodegenerative diseases: a conspiracy theory. PLoS Comp. Biol., 16(10):e1008267, 2020.
[7] T.B. Thompson, G. Meisl, and A. Goriely. The role of clearance mechanisms in the kinetics of toxic protein aggregates involved in neurodegenerative diseases. J. Chem. Phys., 154:125101, 2021.