Many complex systems, such as cities, social media, animal social groups, or brains can be represented using the framework of network science, i.e., as a set of individual units linked together through certain types of interactions. These interactions typically result from a multitude of temporal processes such as adaptation, cascading behavior, or cyclical patterns that all take place simultaneously but often at different spatial and temporal scales. To capture the temporal aspect of these systems, we, Oxford Mathematicians Alexandre Bovet and Renaud Lambiotte together with Jean-Charles Delvenne from the Université catholique de Louvain, represent them as a network of interactions that can be active or not depending on the time. In real life applications, these systems are often very large, with many components, and extracting a simplified view of their structure and evolution can be very challenging.
The task of extracting a simplified, coarse grained, description of such systems is called community detection, or network clustering, and several methods exist to perform it. Here, we propose a novel method for community detection for networks with interactions that are changing in time. Our method uses a diffusion process occurring on the network as a proxy to define how nodes of the network should be grouped together in communities in the coarse grained representation of the system. We mathematically model forward and backward diffusion processes starting at the beginning and ending of a time interval that follows the activation patterns of the temporal network. We consider that two nodes are in the same community if the diffusion processes starting on them tend to stay highly correlated during the evolution of the network. To quantify this aspect, we derived quality functions for the partition of the network into communities based on the covariances of the diffusion processes taking into account the fact that, in such systems, they do not necessarily reach a stationary state.
An advantage of our method is that it allows one to vary the rate of the diffusion process to explore different spatio-temporal scales of the systems under investigation. This permits us to focus on specific processes occurring in a system and to effectively filter-out other undesired processes.
** 
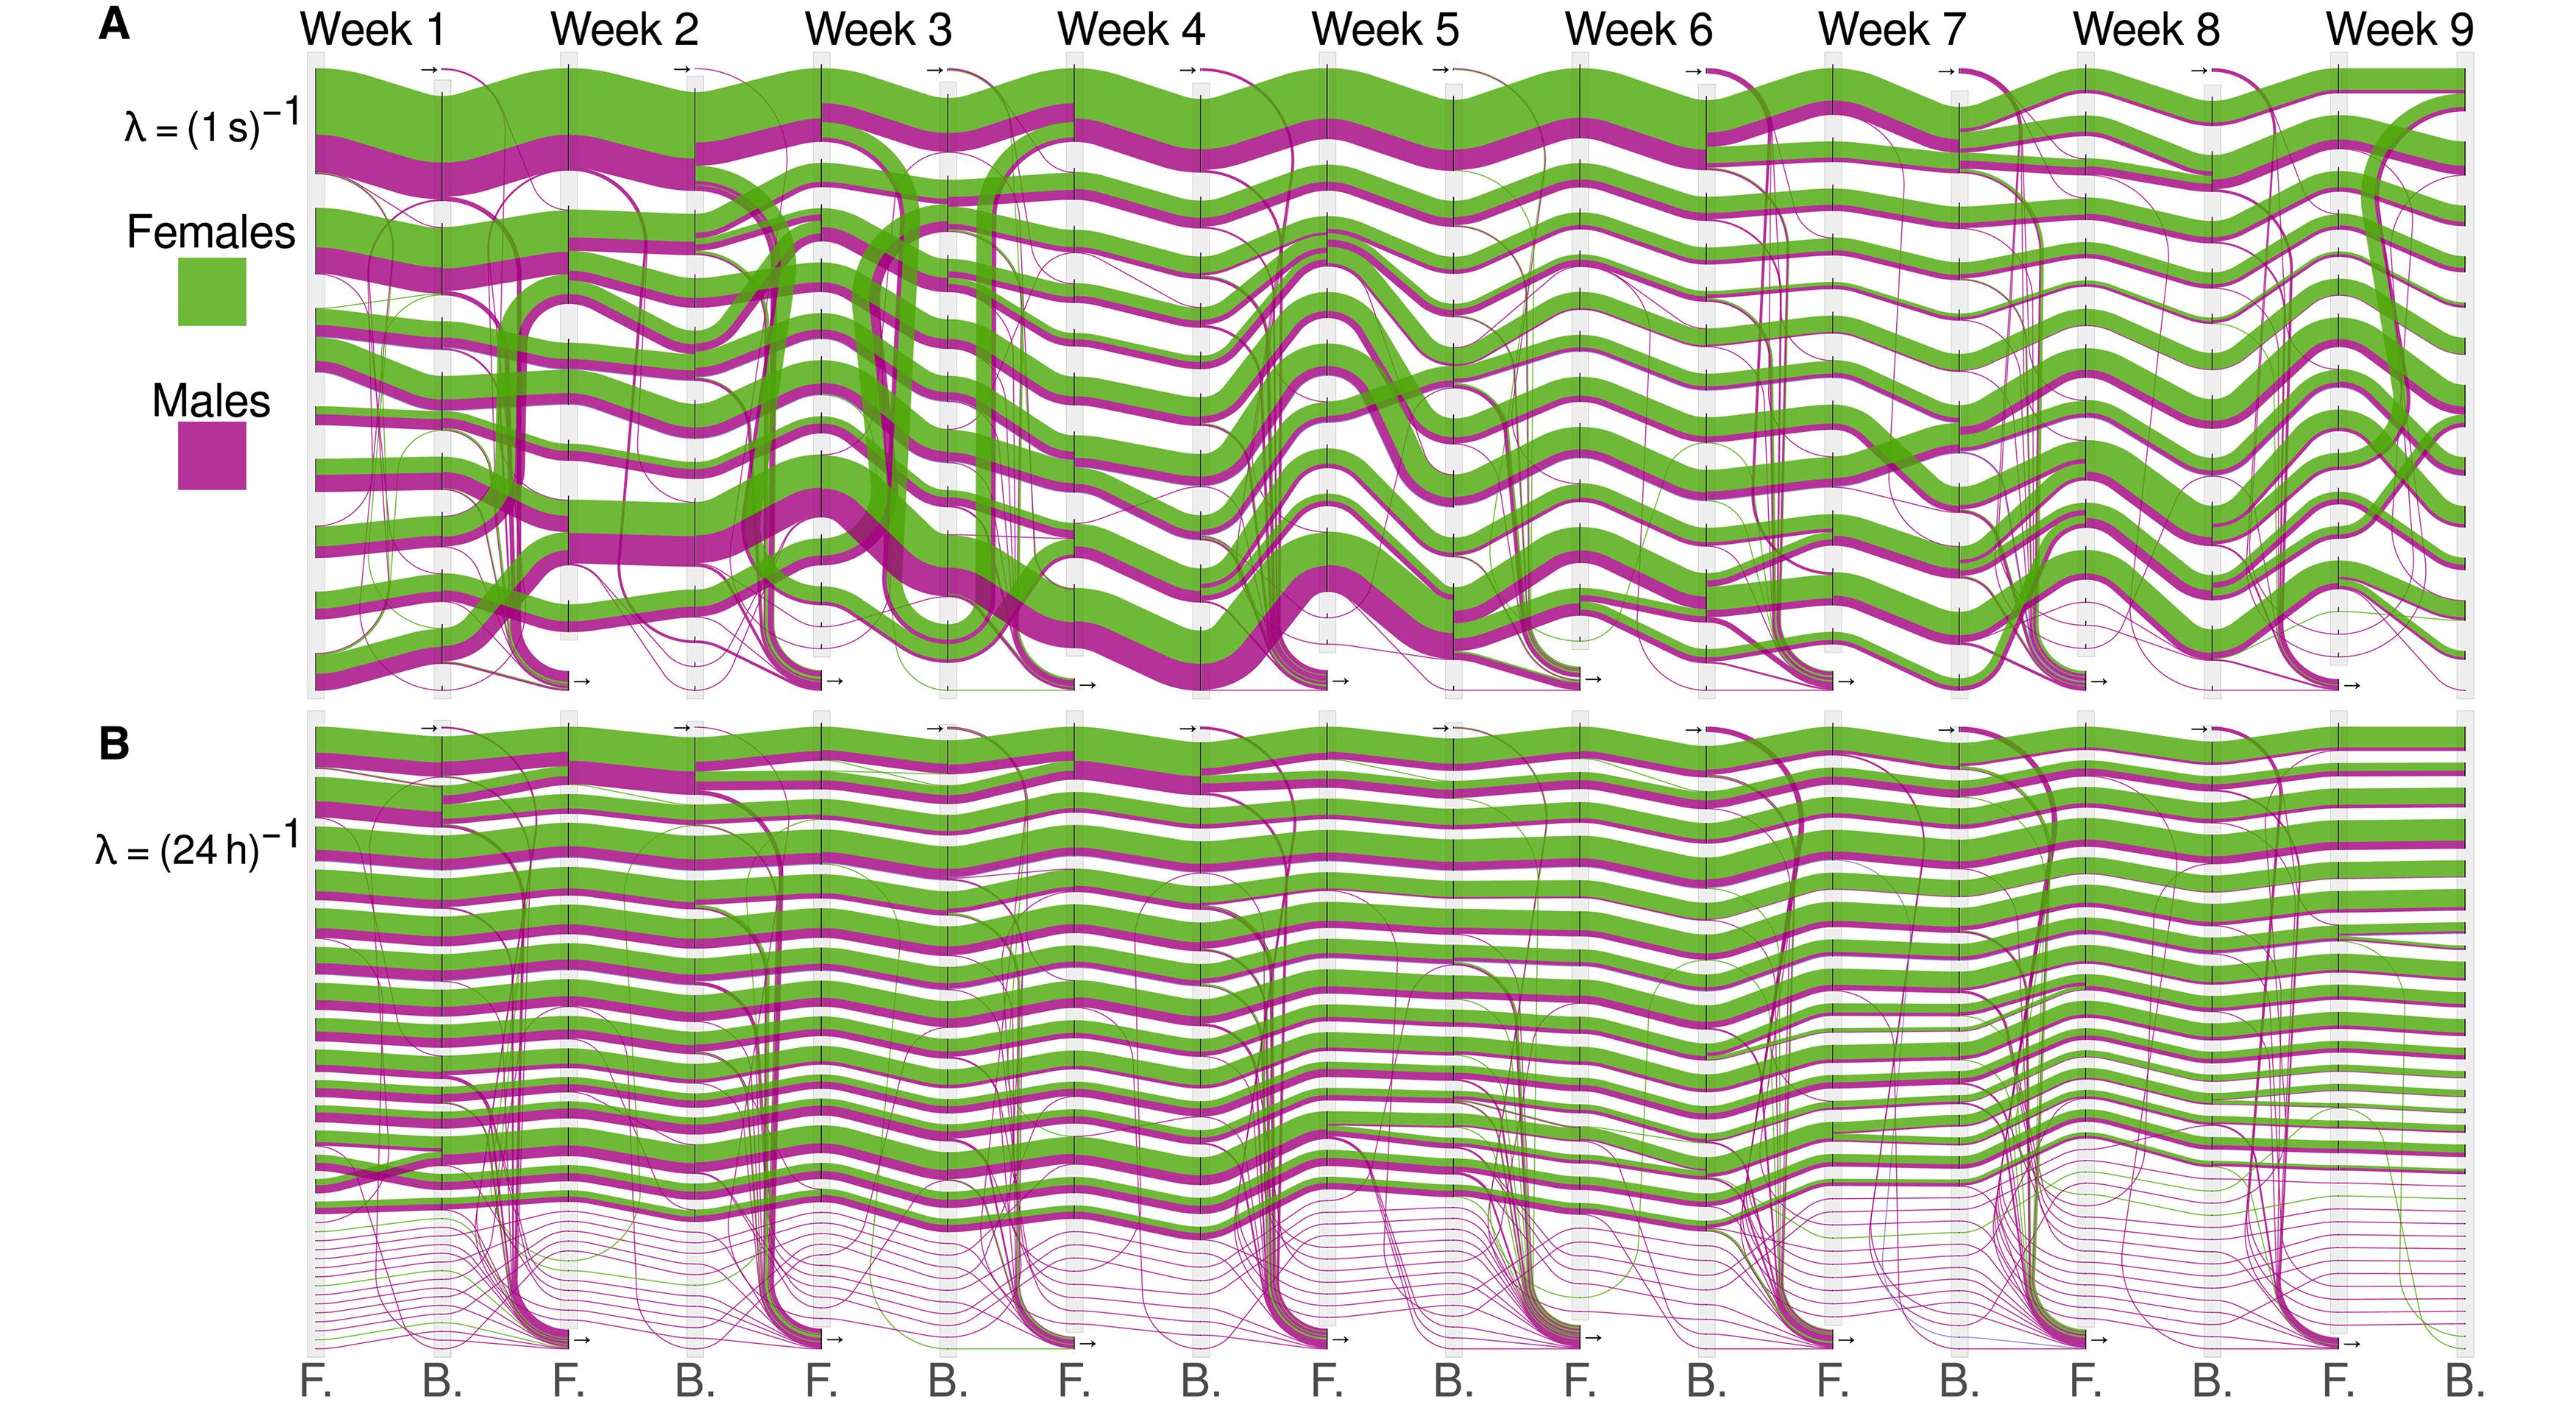
As an example, this figure shows an application of our “flow stability” method to a contact network of free-ranging wild house mice. The alluvial diagram represents the evolution of the communities in this population of mice at two different scales (1/(1 s) and 1/(24 hours). The flow corresponding to females is indicated in green, and the one corresponding to males is in purple. The community dynamics at a rate of (1/(1 s) (A) reveals the existence of large communities during the first weeks corresponding to the end of February and beginning of March, which split in smaller communities as spring arrives. At a rate of 1/(24 hours) (B), a finer description of the dynamics is revealed with the presence of smaller social groups with compositions and sizes that are very stable over the entire observation period. The presence of larger groups in winter may be explained by the benefit of thermoregulation (winter huddles) and by the lower competition for reproduction. The finer description of the dynamics (B) reveals the presence of smaller social groups with compositions and sizes that are very stable over the entire observation period. While the average number of females per group stays extremely stable, the proportion of males decreases in a similar way to the coarser partition, suggesting that the females are forming the cores of the different social groups.
*
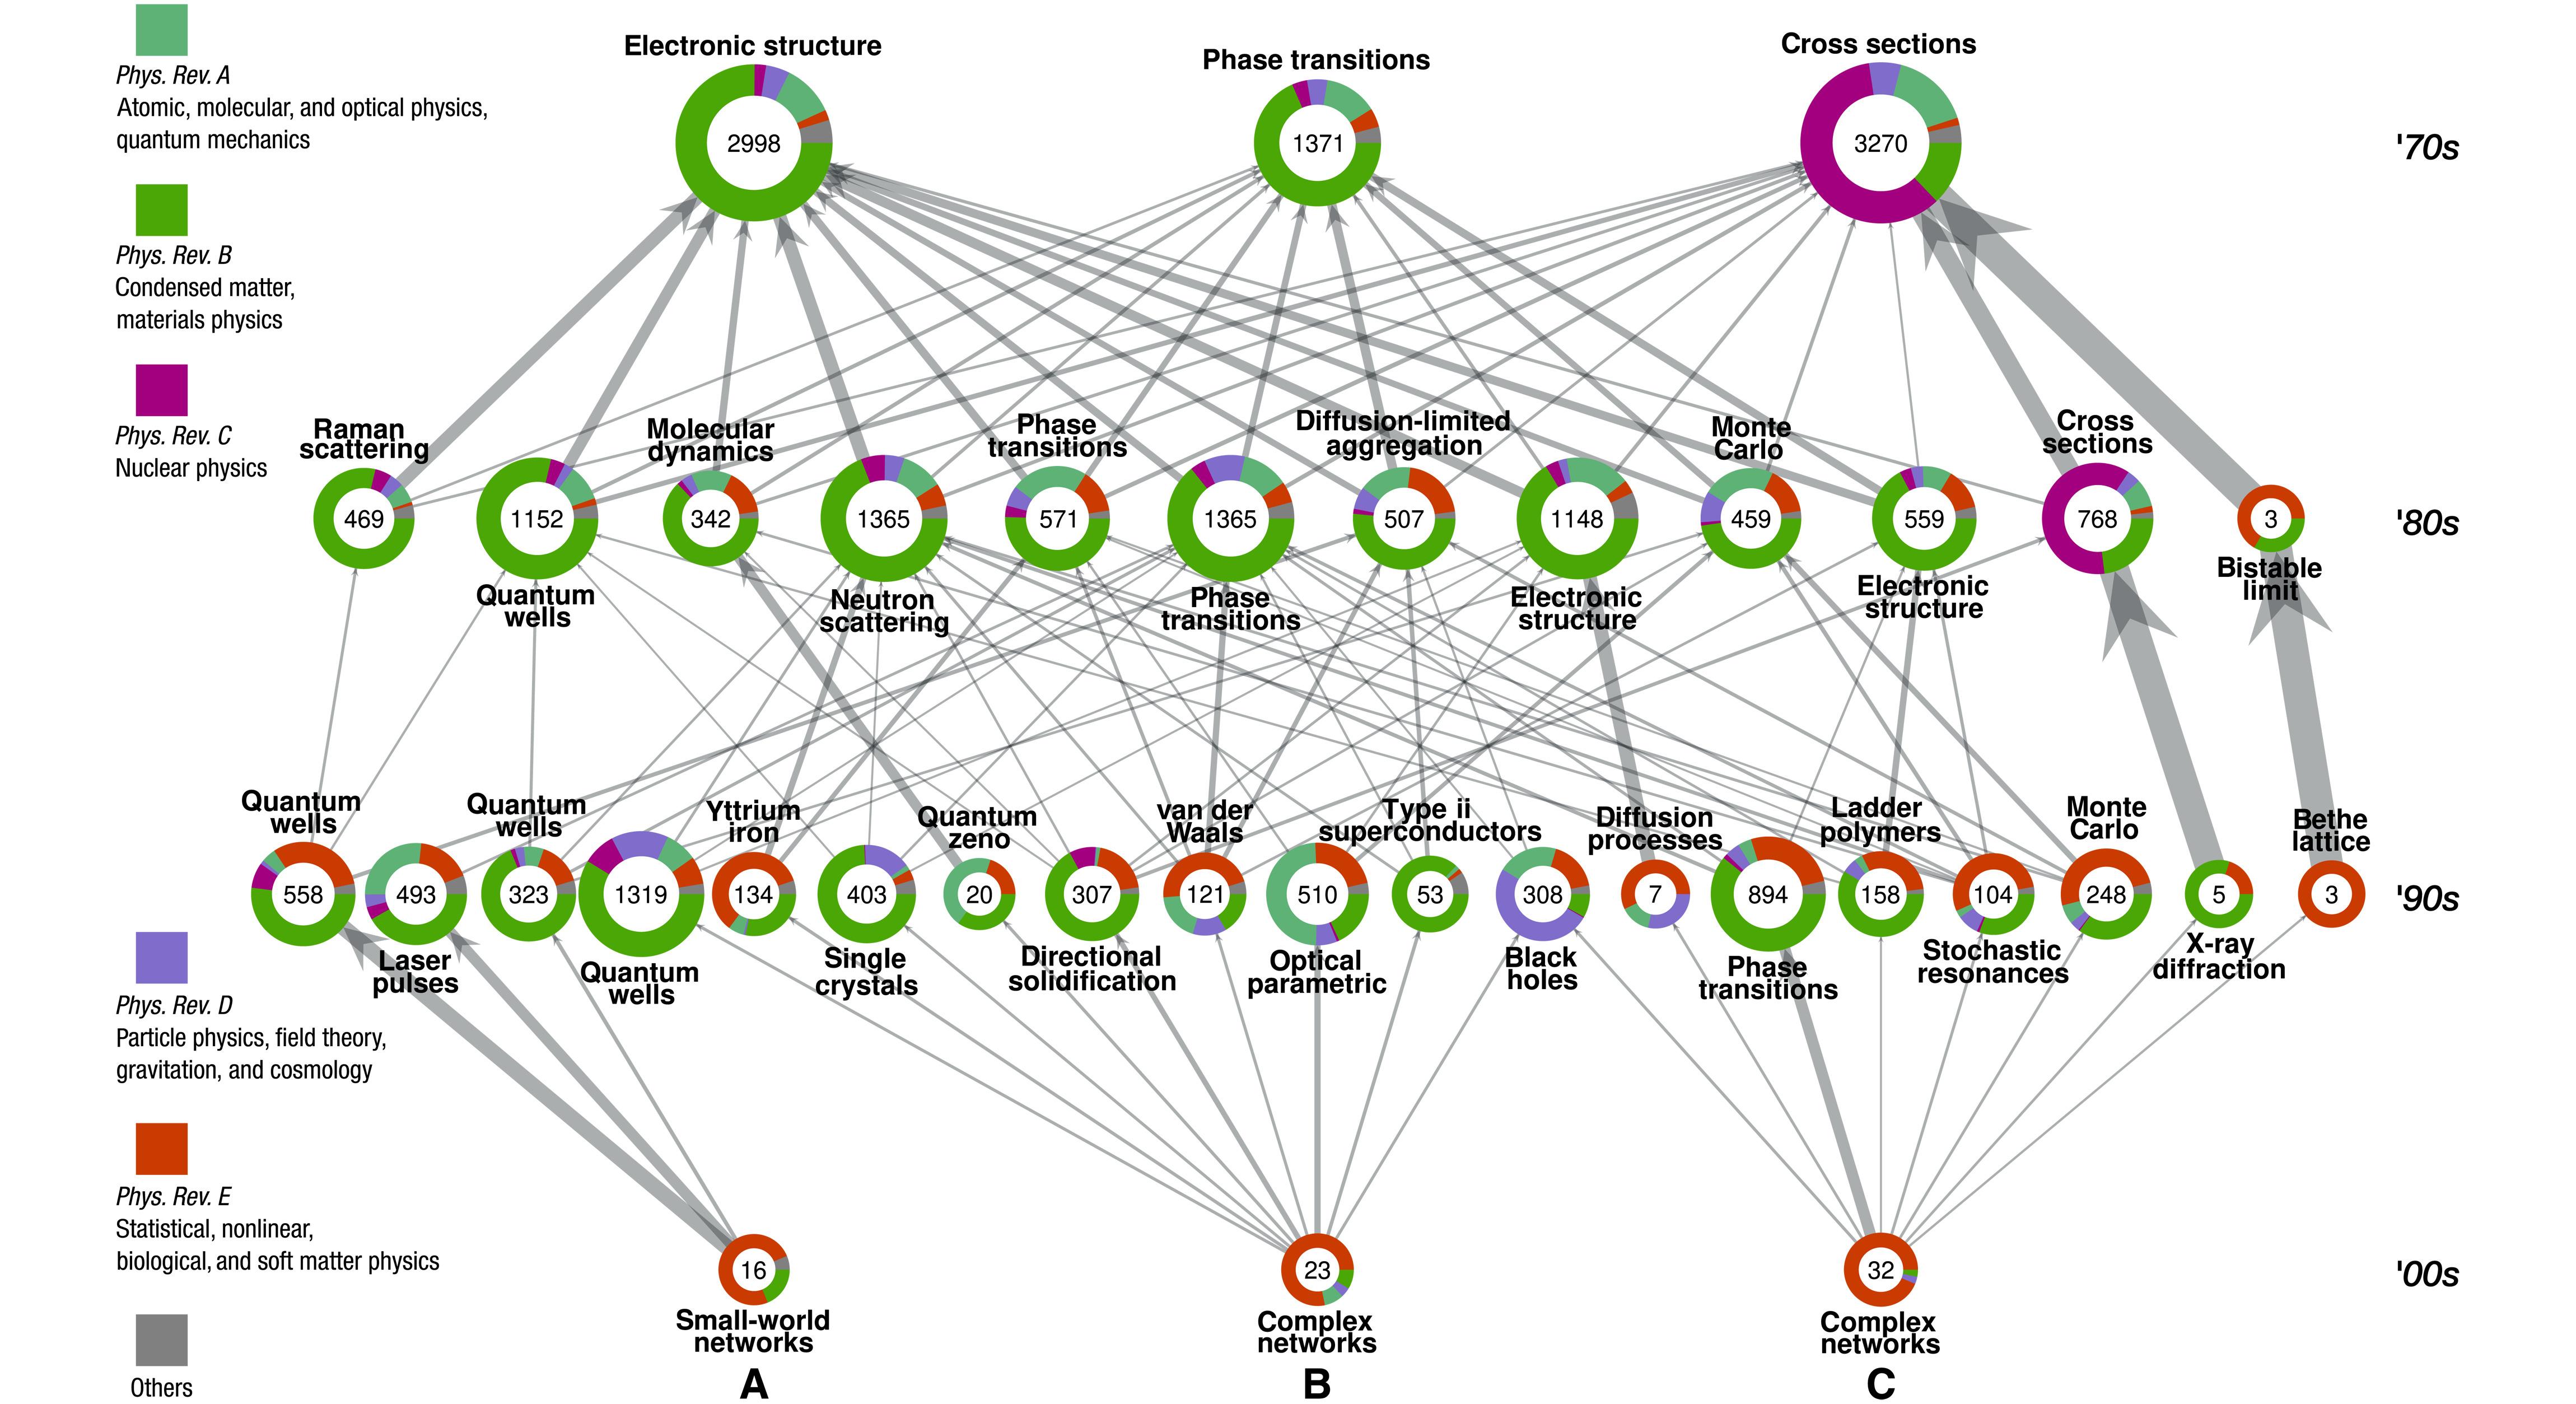
In this example we modelled the diffusion of ideas through a co-authorship network of articles published in the American Physical Society journals. This figure shows the communities of authors from the ‘70s to the ‘90s that influenced three communities of network scientists from the 2000s.
Each node represents a community, and its size is indicated in the centre. The colours represent the distribution of journals inside each community where each author is associated to the journal in which they published the most (except large-scope journals). The pair of words next to each node indicate one of the most frequent pair of words of all the titles of the articles belonging to the community. Arrows between the communities represent probability transitions (>5%) from community to community of the diffusive process starting in 2010 and finishing in 1970. With this example, we demonstrate an original usage of our method for clustering nonstationary processes in temporal networks that allows us to uncover the influences, in the field of physics, of network scientists.
Our framework opens the door for the definition of new concepts for temporal networks in terms of diffusion and flows that helps to disentangle the complex processes simultaneously occurring in systems described as temporal networks.
Find out more in the team's research paper published in Science Advances.


