


The microscopic arrangement of battery materials, known as the microstructure, affects how easily lithium ions move between the electrodes. Mathematical models help explain how these effects influence battery performance and guide the development of faster methods for comparing battery designs.
At the cell level, a battery is characterised by terminal measurements such as voltage and current, but these quantities arise from transport through heterogeneous materials inside the cell. In a multicomponent solid electrolyte, a phase is a compositionally distinct region of the material. Two questions must be kept separate: does a phase form a continuous pathway across the electrolyte, and do lithium ions preferentially occupy that phase? The first concerns microstructural connectivity; the second concerns the chemical conditions that favour lithium ions in one phase over another.
This distinction is central to the work described here. A phase-field simulation first predicts the morphology: how the three components separate and arrange themselves into connected or isolated regions. Phase-dependent contributions to the lithium-ion chemical potential then influence which phases lithium ions prefer to occupy. Phase connectivity and lithium-ion preference are distinct, but together they influence ion transport. By resolving the microstructure, the model can show how these effects interact locally rather than representing their combined influence only through bulk effective parameters.
Simulating ternary electrolyte microstructures
The study considers a ternary polymer blend as a model solid electrolyte. Combining three polymer components allows a broad range of compositions and morphologies. The solid electrolyte lies between the anode and cathode and allows lithium ions to move between them. Changing the relative amounts of the components changes the resulting morphology, meaning the spatial arrangement and connectivity of the phases. In some compositions, one phase forms a continuous background, referred to here as the matrix phase, while the other phases occur as isolated domains within it. A phase is said to percolate if it forms an uninterrupted pathway across the electrolyte, from the anode-facing boundary to the cathode-facing boundary. Depending on the morphology, more than one phase may percolate.
We denote the model components by \(A\), \(B\) and \(C\), and the corresponding \(A\)-rich, \(B\)-rich and \(C\)-rich phases by \(\alpha\), \(\beta\) and \(\gamma\), respectively. In this work, the component properties were based on polytetrafluoroethylene, poly(vinyl chloride) and poly(hexamethylene adipamide), respectively [1]. We use \(i\) for a component index and \(p\) for a phase index. To generate these morphologies, the blend is described by a ternary Flory–Huggins bulk free energy and a Cahn–Hilliard free-energy functional [1–3]:
\[ \begin{aligned} \mathcal{F} &= \int_V \left[ f(\phi_A,\phi_B,\phi_C) + \sum_{i=A,B,C}\kappa_i\lvert\nabla\phi_i\rvert^2 \right] \, \mathrm{d}V,\\[0.25em] f(\phi_A,\phi_B,\phi_C) &= \frac{RT}{V_m}\Bigg[ \chi_{AB}\phi_A\phi_B + \chi_{BC}\phi_B\phi_C + \chi_{CA}\phi_C\phi_A \\ &\qquad + \frac{\phi_A}{N_A}\ln\phi_A + \frac{\phi_B}{N_B}\ln\phi_B + \frac{\phi_C}{N_C}\ln\phi_C \Bigg], \qquad \phi_A+\phi_B+\phi_C=1. \end{aligned} \]
Here, \(\mathcal{F}\) is the total free energy over the model domain \(V\), and \(f\) is the bulk free-energy density. The quantity \(\phi_i\) is the local volume fraction of component \(i\), \(R\) is the universal gas constant, \(T\) is the absolute temperature, and \(V_m\) is a reference molar volume. The dimensionless Flory–Huggins parameter \(\chi_{ij}\) describes interactions between components \(i\) and \(j\), while \(N_i\) is a dimensionless relative molecular-size parameter. The quantity \(\kappa_i\) is the gradient-energy coefficient. In dimensional form, \(f\) has units of \(\mathrm{J\,m^{-3}}\) and \(\kappa_i\) has units of \(\mathrm{J\,m^{-1}}\).
The resulting ternary Cahn–Hilliard equations describe how the local composition evolves as the system lowers its free energy. They are obtained from the variational derivatives of the free-energy functional above, together with mobility relations for the two independent composition fields. These equations were solved numerically to generate several three-dimensional morphologies from selected points on the ternary phase diagram [1]. In plain terms, this first calculation predicts how the three components arrange themselves in space; it does not yet simulate battery operation.
Animation. Illustrative evolution of a three-dimensional phase-field composition variable from a diffuse initial state towards separated domains. The colours represent the composition field.
Under the specified simulation conditions, the selected compositions produced different patterns of phase connectivity. An \(A\)-rich blend can contain an \(\alpha\) matrix phase with isolated \(\beta\) and \(\gamma\) domains. A \(C\)-rich blend can reverse that arrangement. Near more balanced compositions, multiple phases may become connected. These differences determine which continuous pathways exist before electrochemistry is introduced.
Embedding the resolved electrolyte in a battery model
The generated electrolyte microstructure is placed between the anode and cathode regions of the model. Smooth indicator functions, mathematical fields that identify each region, represent the anode, the three electrolyte phases \(\alpha\), \(\beta\) and \(\gamma\), and the cathode. These functions vary smoothly across narrow transition zones that represent the diffuse internal boundaries. This avoids explicitly tracking every curved phase boundary and allows the simulated morphology to enter the electrochemical calculation directly [1,4].
Lithium-ion transport is formulated in terms of chemical and electrostatic driving forces. Writing the phase-dependent model of Kaka et al. in molar ionic notation [1,5], for electrolyte phase \(p\in\{\alpha,\beta,\gamma\}\) we write
\[ \mu_p = RT\ln x_p + E_p, \qquad \widetilde{\mu}_p = \mu_p + zF\psi. \]
Here, \(\mu_p\) and \(\widetilde{\mu}_p\) are the molar chemical and electrochemical potentials of lithium ions in phase \(p\), respectively. The quantity \(x_p\) is the dimensionless lithium-ion mole fraction, treated as its activity under the ideal-solution approximation. The constant \(E_p\equiv\mu_{\mathrm{Li}^+,p}^{\circ}\) is the phase-dependent standard chemical potential of lithium ions, namely the chemical potential at the chosen standard state. It therefore acts as a constant offset in the lithium-ion chemical potential for that phase.
The charge number is \(z=+1\) for \(\mathrm{Li}^+\), \(F\) is Faraday's constant, and \(\psi\) is the electrostatic potential. Thus, \(RT\ln x_p\), \(E_p\) and \(zF\psi\) all have units of \(\mathrm{J\,mol^{-1}}\).
For two electrolyte phases at the same electrochemical potential, their equilibrium mole-fraction ratio depends on both the difference between their \(E_p\) values and the electrostatic-potential difference. In particular, if their electrostatic potentials are equal, the phase with the smaller \(E_p\) has the larger equilibrium lithium-ion mole fraction. At fixed electrostatic-potential differences, a common shift of only the electrolyte \(E_p\) values leaves these phase-to-phase ratios unchanged, but need not leave absolute concentrations or the cell potential unchanged when electrode reference values or boundary data are held fixed.
At equilibrium, the electrochemical potential of the mobile lithium species represented by the model is uniform throughout each connected region accessible to that species. At each electrode–electrolyte interface, Butler–Volmer kinetics describe the interfacial charge-transfer reaction. At equilibrium there is no net thermodynamic driving force, so the net reaction rate is zero. The transport and electrostatic equations are written as
\[ \begin{aligned} \omega\frac{\partial\mu}{\partial t} &= \nabla\!\cdot\!\left[m\nabla(\mu+zF\psi)\right] + \dot{R}_{c},\\ \nabla\!\cdot\!\left(\varepsilon\nabla\psi\right) &= -\rho. \end{aligned} \]
Here, \(\mathbf{x}\) denotes position, \(t\) denotes time, and \(c(\mathbf{x},t)\) is the local molar concentration of mobile lithium ions. The phase-specific mole fraction \(x_p\) introduced above is related to \(c\) through the constitutive relation for phase \(p\). The fields \(\mu(\mathbf{x},t)\) and \(\widetilde{\mu}(\mathbf{x},t)=\mu+zF\psi\) are the corresponding spatially continuous chemical and electrochemical potentials. The chemical susceptibility \(\omega=\partial c/\partial\mu\) measures how sensitively concentration changes with chemical potential. The chemical mobility \(m\) is defined so that \(\mathbf{N}=-m\nabla\widetilde{\mu}\) is the molar lithium-ion flux.
The reaction term \(\dot{R}_{c}\) is the signed volumetric molar source or sink produced by interfacial charge transfer, with units of \(\mathrm{mol\,m^{-3}\,s^{-1}}\). If \(j_{\mathrm{BV}}\) is the signed Butler–Volmer interfacial current density, taken as positive when the reaction produces lithium ions in this concentration balance, its diffuse-interface representation is
\[ \dot{R}_{c}=\frac{a_\Gamma j_{\mathrm{BV}}}{zF}. \]
Here, \(a_\Gamma\) is the regularised interfacial area per unit volume. The phase indicator functions smoothly interpolate phase-dependent quantities such as \(m\) and \(\omega\) across the interfaces.
In Poisson's equation, \(\rho\) is the free-charge density and \(\varepsilon\) is the permittivity.
What the microstructural model reveals
The simulations compare several ternary morphologies with several relative orderings of \(E_\alpha\), \(E_\beta\) and \(E_\gamma\). In the tested parameter set, the equilibrium cell voltage changes only weakly across the cases. Under an imposed discharge current density, however, the steady-state terminal voltage, charge-density field and nondimensional power-density metric depend on both the local phase arrangement and the relative ordering of the \(E_p\) values [1].
The mechanism can be seen clearly in an \(A\)-rich morphology. Its \(\alpha\) phase is the matrix phase, while the \(\beta\) and \(\gamma\) phases occur mainly as isolated domains. When \(E_\alpha\) has the smallest value, the model favours lithium-ion occupation of the \(\alpha\) matrix phase. Lithium ions therefore preferentially occupy a phase that provides a continuous pathway across the electrolyte. When \(E_\alpha\) has the largest value, the phases with smaller \(E_p\) values occur mainly as isolated \(\beta\) and \(\gamma\) domains. The simulations then show local lithium-ion accumulation and a smaller magnitude of the steady-state terminal voltage at the imposed current.
The same mechanism applies to the other morphologies, but the favourable ordering changes with the identity of the matrix phase. In the \(C\)-rich blend, the \(\gamma\) phase is the matrix phase, whereas in the \(B\)-rich blend the \(\beta\) phase is the matrix phase. The conclusion is therefore not that one phase or blend is universally best. In the reported comparisons, assigning the smallest \(E_p\) to the matrix phase, which forms a continuous pathway across the electrolyte, increased the magnitude of the steady-state terminal voltage relative to configurations in which that matrix phase had a larger \(E_p\). At the imposed current, this also increased the reported nondimensional power-density metric. The ordering of \(E_\alpha\), \(E_\beta\) and \(E_\gamma\) that gave the highest power-density metric nevertheless depended on the morphology, so lithium-ion distribution and phase connectivity must be considered together [1].
By resolving the microstructure, the model identifies continuous transport pathways and regions of lithium-ion accumulation, including within isolated domains. It also helps explain why materials with similar overall compositions can respond differently when their phase connectivity differs. The terminal voltage records the outcome, but the spatial fields explain the mechanism.
Homogenised and reduced-order models for battery design
The same spatial detail that makes the microstructure-resolved calculation informative also makes it expensive. Each design point may require a three-dimensional phase-field simulation followed by a microstructure-resolved electrochemical calculation. Repeating that workflow across many blend ratios, phase properties, cell geometries and operating currents is rarely practical.
Homogenised cell-scale models make such comparisons more tractable. For example, the Doyle–Fuller–Newman (DFN) framework describes porous-electrode batteries using volume-averaged conservation laws and effective transport properties [6–8]. Reduced-order models simplify those equations further and can support large parameter sweeps, optimisation, sensitivity analysis, parameter inference and control [8,9].
These modelling levels are complementary. The microstructure-resolved continuum model shows that phase volume fractions alone are insufficient because connectivity and the preferred distribution of lithium ions jointly influence transport. A homogenised cell-scale model or a reduced-order model could retain these effects through, for example, a percolation-sensitive effective ionic conductivity, an explicit connectivity descriptor, or a constitutive relation for the lithium-ion distribution among phases based on differences between the \(E_p\) values. The microstructure-resolved calculation therefore identifies what the faster model needs to retain.
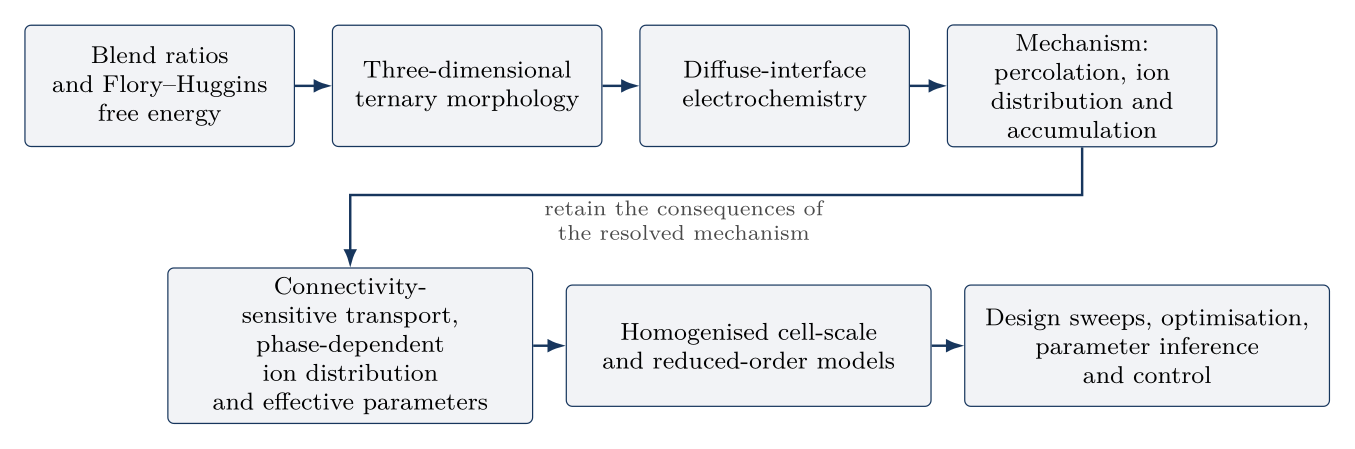
Flowchart. Ternary phase-field and diffuse-interface calculations reveal how phase connectivity and the relative ordering of the \(E_p\) values influence local transport. Homogenised cell-scale and reduced-order models retain selected consequences for rapid design sweeps.
In my current work at Oxford, I develop homogenised cell-scale and reduced-order models for structured battery electrodes. These models allow many candidate cell designs to be compared efficiently while retaining the mechanisms needed to interpret cell performance.
Fiyanshu Kaka is a Research Associate in Battery Modelling at the Mathematical Institute, University of Oxford, working on the Faraday Institution's Nextrode project.
References
- F. Kaka, K. S. K. Chivukula and Parul, “Deciphering the Influence of Multi-Component Blends and Their Electronic Band Structure on the Performance of All-Solid-State Batteries”, Electrochimica Acta 511 (2025), 145340. doi:10.1016/j.electacta.2024.145340.
- J. W. Cahn, “Phase Separation by Spinodal Decomposition in Isotropic Systems”, The Journal of Chemical Physics 42(1) (1965), 93–99. doi:10.1063/1.1695731.
- L.-Q. Chen, “Phase-Field Models for Microstructure Evolution”, Annual Review of Materials Research 32 (2002), 113–140. doi:10.1146/annurev.matsci.32.112001.132041.
- F. Kaka, S. Khanna, P. C. Ramamurthy and A. Choudhury, “Investigation of Process–Structure–Property Relationship in Ternary Organic Photovoltaics”, Journal of Applied Physics 128(14) (2020), 145501. doi:10.1063/5.0020863.
- J. Newman and K. E. Thomas-Alyea, Electrochemical Systems, 3rd ed., Wiley, 2004.
- J. Newman and W. Tiedemann, “Porous-Electrode Theory with Battery Applications”, AIChE Journal 21(1) (1975), 25–41. doi:10.1002/aic.690210103.
- M. Doyle, T. F. Fuller and J. Newman, “Modeling of Galvanostatic Charge and Discharge of the Lithium/Polymer/Insertion Cell”, Journal of The Electrochemical Society 140(6) (1993), 1526–1533. doi:10.1149/1.2221597.
- F. Brosa Planella et al., “A Continuum of Physics-Based Lithium-Ion Battery Models Reviewed”, Progress in Energy 4(4) (2022), 042003. doi:10.1088/2516-1083/ac7d31.
- S. G. Marquis et al., “An Asymptotic Derivation of a Single Particle Model with Electrolyte”, Journal of The Electrochemical Society 166(15) (2019), A3693–A3706. doi:10.1149/2.0341915jes.