B is for Bayesian Inference
The Author
Professor Robin Evans
Associate Professor and Robin Kay Fellow in Statistics, Jesus College
Robin Evans is an associate professor of statistics at the University of Oxford, and a fellow of Jesus College. His academic research concerns graphical models and causal inference, but he also takes an interest in the way statistics are presented and understood in popular media. You can find him on Twitter at @ItsAStatLife, and read his blog at It's A Stat Life.
Find out more
Robin has written articles for Significance magazine, including "Can a gamble ever be right or wrong?" and "Frog kissing.".
"Making the most of Citizen Science" explains how Bayesian probability is used in intelligent machine learning to improve crowd sourced science.
Statistics Taster Days run by the Department of Statistics for year 12 students explore how statistics is used, with workshops on a wide variety of applications.
Understanding Uncertainty aims to explain risk and uncertainty to the general public and is run by Professor David Spiegelhalter.
Oxford Computational Statistics uses Bayesian inference to develop models of language, investigate genetic processes, and unsupervised machine learning (one of the potential precursors to artificial intelligence).
B is for Bayesian Inference
Humans love to find an explanation that fits the facts, and fits them as closely as possible. But this often turns out to be a terrible way of learning about the world around us.
Imagine you’re young, healthy and at the doctor for a regular check-up. The doctor offers you a new test for a rare disease. Only about 2.5% of people have it, but it’s best to be reassured. The test is good: it has 80% accuracy.
Unfortunately you test positive for the disease. How should you feel about that? You’ll probably be worried. The explanation which best fits the facts (i.e. the positive test) is clear: you have the disease. It’s a lot more likely that you’d see a positive test if you have the disease (80%) than if you don’t (20%).
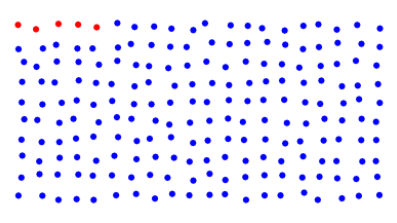
But you’d be wrong to be all that worried. Imagine 200 people represented by the 200 dots below. You’re one of the dots, but you don’t know which one. The 5 red dots represent the 2.5% of people with the disease.

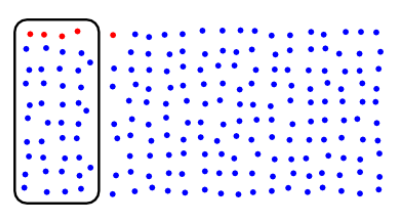
Let’s test everyone, and draw a ring around the people who test positive. The test is 80% accurate, so we net 4 of the 5 cases (80%), and 39 out of the 195 disease-free people (20%).

Just looking at people who, like you, have tested positive, only 4 out of 43 (about 9%) actually have the disease; the rest are false positives.
Bayesian probability considers the different possibilities that could have led to the evidence in front of you. In your case, either:
- you have the disease, and correctly tested positive. The probability of that happening is 0.025 x 0.80 (around 1 chance in 50).
- you don’t have the disease, and wrongly tested positive. The probability of that happening was 0.975 x 0.2 (around 1 in 5).
Bayesian Inference compares the probabilities of these events to see which is more likely. In this case it’s about 10 times more likely that you don’t have the disease than that you do.
Bayes’ Theorem is used in criminology, product recommendations, artificial intelligence, and recently in the search for the missing Malaysian Airliner MH370. In this last case the number of different possibilities being considered is vast - in fact, it will involve an infinite range of potential crash sites - but the principle is exactly the same.
Imagine a huge grid of search locations each with a prior probability attached. These probabilities could be based on the plane’s fuel level and its last known direction. MH370 also communicated with a satellite, and people at Inmarsat used this data to narrow down the search.

With each area of the search space we associate a number, based on how likely we would have been to see the satellite data if the plane had crashed in that place: this is the likelihood. Bayesian inference tells us to multiply the prior by the likelihood, and obtain the posterior. This number gives us the relative importance of each square in the search space: the investigators started to search the areas with highest posterior values first. If the plane isn’t found, this evidence can be used to update the probabilities associated with each search space.
It’s a remarkably simple method but incredibly powerful. And it might help reassure you after some bad news from the doctor.


