


Visualisation Solutions
Part of the Oxford Maths Admissions Test Livestream 2026
These are the solutions for the Visualisation worksheet
Warm-up
- We could draw a graph with time on the horizontal axis and altitude on the vertical axis. For time, the range is 09:00 to 17:00. For altitude, is the range from the base camp to the summit? The summit is presumably the highest possible altitude, but there's nothing to say that Alice and Charlie don't go below the altitude of base camp at any point (this does not matter for the question, but it's good practice to think about whether we're making any false assumptions while we're reasoning about the diagram.)
- The graph of Alice's altitude over time starts in the lower-left corner and ends in the top-right corner, because Alice starts down at base camp and ends up at the summit of the mountain.
Similarly, the graph of Charlie's altitude over time starts in the top-left corner and ends in the lower-right corner.
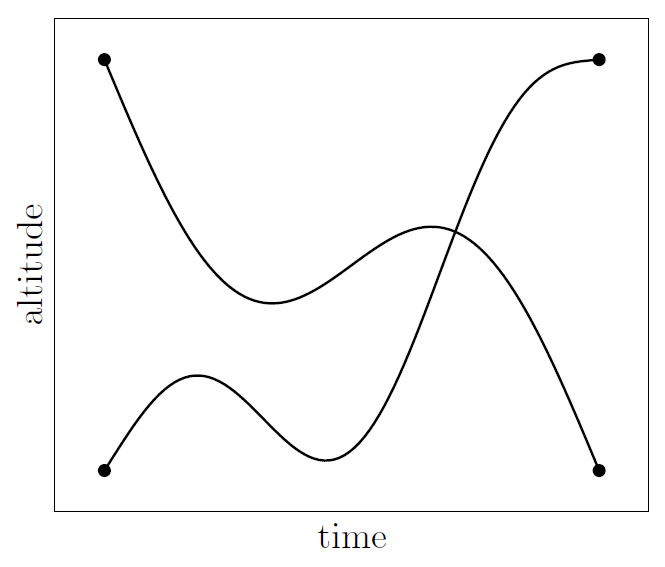
- At some point, those lines must cross, when Alice switches from being lower down the mountain to higher up the mountain. At that exact moment, the altitudes are the same.
- To make this precise, we would need the Intermediate Value Theorem, which is something that you would learn in the first year of a Mathematics degree at Oxford (in the Analysis II course in the second term). You could think of the Intermediate Value Theorem as being something similar to the sign-change rule; for a continuous function with real inputs, if $f(0)<0$ and $f(1)>0$ then there's a value of $x$ in-between where $f(x)=0$.
Questions
TMUA 2021 Paper 1 Question 9
- Let's draw the graph, one quadrant at a time. I've chosen to work quadrant-by-quadrant because I know that the sign of $x$ and the sign of $y$ will be enough information for me to replace $|x|$ and $|y|$ with something simpler.
- For example, in the first quadrant where $x>0$ and $y>0$, we have $|x|=x$ and $|y|=y$ so the graph is just $x+y=1$.
For the other quadrants, I could work through them one-by-one, or I could notice that, since the graph only involves $|x|$ (and never $x$ on its own), it will have reflectional symmetry in the $y$-axis. Similarly for the $x$-axis.
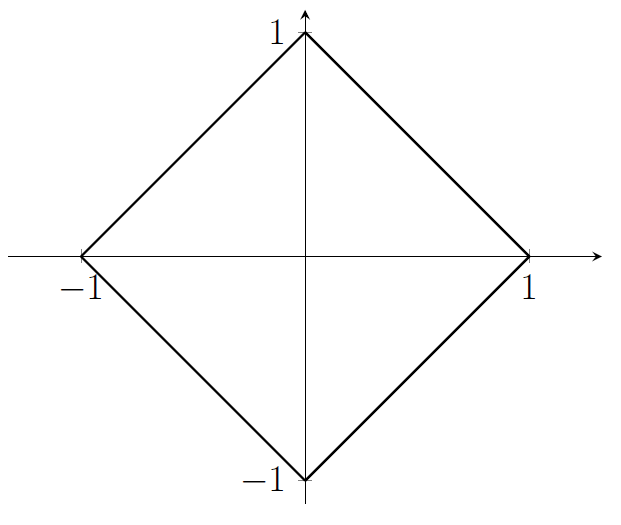
- I could integrate at this point to find the area under/above the curve in each quadrant, but look! It's a square!
- With more reasoning to back up that claim; each side is at 45 degrees to the axes, so the sides meet at right angles, and all four sides have the same length because of the reflectional symmetries.
- What's the side length of this square?
- We know that two of the corners are at $(1,0)$ and $(0,1)$.
- The distance between those points is $\sqrt{2}$.
- That gives the area as $(\sqrt{2})^2=2$.
- The answer is C.
Extension
- Find the area enclosed by the graph of $|ax|+|by|=|c|$ where $a$, $b$, and $c$ are positive real numbers.
- In 3D space with coordinates $(x,y,z)$, the points with $|x|+|y|+|z|=1$ all lie on the surface of a 3D shape. Describe that shape. Find its volume.
TMUA 2021 Paper 1 Question 14
- It would be hard to solve this algebraically!
- Instead, let's draw graph of both on the same axes.
- I only care about the region with $-1\leq x \leq 3$, because I know that the cosine graph on the right-hand side will be non-negative.
- I'll think about values at $x=-1$, $0$, $1$, $2$, and $3$.
\(x\) \(-1\) \(0\) \(1\) \(2\) \(3\) \( (x+1)(3-x) \) \(0 \) \(3\) \(4 \) \(3 \) \(0 \) \( 2 (1- \cos(\pi x) ) \) \( 4\) \( 0\) \( 4\) \(0 \) \( 4\) 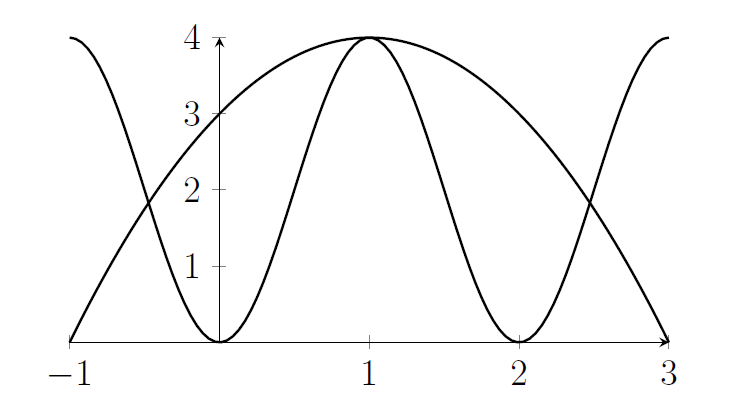
- Crossings (formally, we're using the intermediate value theorem mentioned in the solution to the warm-up problem above!) will occur between $x=2$ and $x=3$, and also between $x=-1$ and $x=0$.
- We've also found a point ($x=1$) where the graphs touch.
- Are there any points in between $x=1$ and $x=2$?
- Probably not? I've drawn the cosine graph decreasing pretty sharply from its maximum value of 4, and the quadratic decreasing slower. Similarly for $0
- For TMUA, that's good enough. The TMUA specification doesn't have the derivative of $\cos$ or the double-angle formulas, so we're quite limited in what we can do to add precision to the hunch that there aren't any crossings for $1
- The answer is B.
Extension
- Let's prove that there are no crossing points for $1<x<2$. Show that translating the graph "left by one unit" converts this to the equivalent problem of proving that $2(1+\cos(\pi x))<4-x^2$ for $0<x<1$.
Using the following facts, prove the inequality.
Facts; $\cos(\pi x)= 2\cos^2\left(\frac{\pi x}{2}\right)-1$, and $\sin\left(\frac{\pi x}{2}\right)>x$ for $0
TMUA 2022 Paper 2 Question 12
- These integrals represent areas.
- We should plot the functions. If we can sort the functions then we can sort the areas.
- To do that, we need to think about the exponents $\sqrt{x}$ and $x$... and I'm going to re-write $\left(\sqrt{2}\right)^x$ as $2^{x/2}$ so that I can include it in this comparison.
So perhaps I don't want to sketch the functions, I want to sketch $\sqrt{x}$ and $x$ and $x/2$.
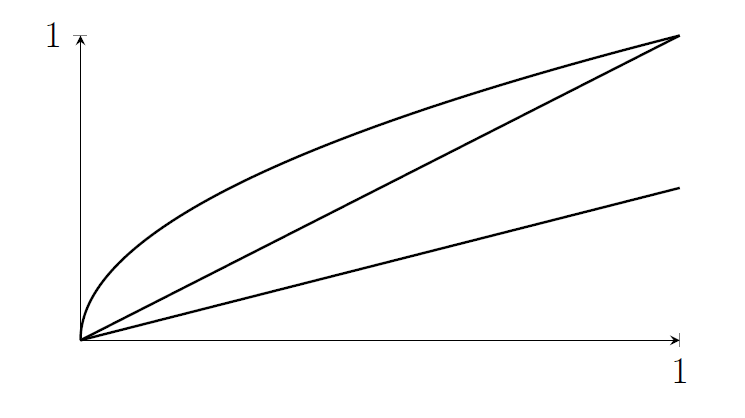
- That gives me a clear sequence for the exponents.
- I don't need to actually sketch $2^x$ and $2^{\sqrt{x}}$ and $2^{x/2}$. The function $f(x)=2^x$ is an increasing function, so whichever exponent is the largest will give the largest value.
- So the order is preserved; $2^{\sqrt{x}}$ will be larger than $2^x$ because $\sqrt{x}$ is larger than $x$, for the range of $x$ under consideration.
- Therefore the area under the graphs will also be in that order.
- I have $P$ as the greatest, followed by $Q$, then followed by $R$.
- They were in exactly reverse order!
- The answer is F.
Extension
- Using radians for $\sin$, let $\displaystyle S=\int_0^1 2^{\sin x}\,\mathrm{d}x$. Where would $S$ appear in your ordering?
Hint: for $0<x<1$, the derivative of $\sin x$ is somewhere between $\frac{1}{2}$ and $1$.
MAT 2022 Q1J
- At first, it looks like we'll need to write down the discriminant for each of these quadratic equations. That seems difficult.
- The question asks about lines $y=mx+c$, and that's a clue to think about geometry.
- We should be careful, because a vertical line cannot be represented in the form $y=mx+c$.
- Here's an example of the link between algebra and geometry that I'm thinking about. Imagine that we had the circle given by the equation $(x-3)^2+(y-1)^2=1$ and we wanted to find the number of times that the line $y=mx+c$ crossed or met this circle.
- To do that, we would substitute $mx+c$ for $y$ and look for solutions. Then "repeated root for $x$" means "a unique value of $x$ where the line crosses the circle". The line is tangent to the circle.
- So we have a geometrical interpretation for the second piece of information in the question; the line $y=mx+c$ should be tangent to a particular circle.
- Similarly, the geometrical interpretation of the first piece of information in the question is that the line $y=mx+c$ should also be tangent to the circle $x^2+y^2=1$.
We're being asked how many lines $y=mx+c$ are tangent to both circles. The easiest way to think about this is to just try sketching the circles and a bunch of lines.
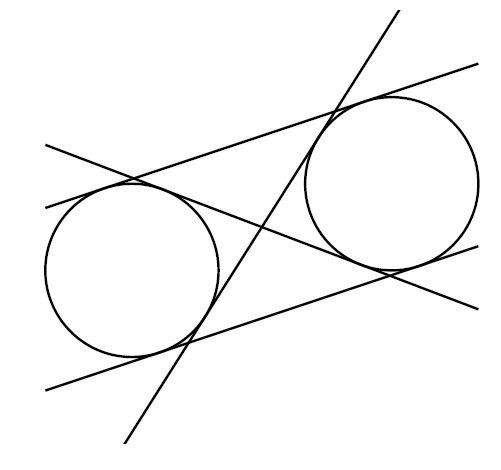
- I drew some lines above both circles. Only one such line is tangent to both circles. Similarly for a line below both circles.
- Then I drew some lines between the circles; above/below one of each. That gave me a couple more lines.
- None of these lines are vertical, so they can be written in the form $y=mx+c$.
- There are four lines in total that are tangent to both circles.
- The answer is (E).
Extension
- (Hard/Tedious!) Find the equations of all four lines.
MAT 2023 Q1J
- We need to understand the function before we can integrate it.
- Questions that combine integration with the $\lfloor x \rfloor$ function often involve the areas of various rectangles.
- For this function, the key thing to understand is $\lfloor \log_2(x) \rfloor$ between $x=0$ and $x=2$.
- $\log_2(x)$ is negative for $0<x<1$, but that's not too bad.
- $\log_2(x)$ is positive for $1<x<2$, but here's the key thing about $\lfloor x \rfloor$ that makes this question easier; in that range, $\lfloor \log_2(x)\rfloor$ is just 0. The value of the logarithm doesn't get large enough for the "largest whole number that is less than or equal to it" to be anything larger than 0.
- Jumping ahead a few steps, the graph of $f(x)$ will be a flat line for this range, and the area underneath will be the area of a rectangle.
- For $0<x<1$, the logarithm is negative, but there will be some region where it will still be greater than $-1$. What's that range? It's $\frac{1}{2}<x<1$. In that region, $\lfloor \log_2(x)\rfloor$ is just $-1$, and the graph will be flat for another rectangle.
- This keeps happening as we approach $0$.
In fact, we have infinitely many rectangles, because $\log_2(x)$ will decrease past all the negative whole numbers.
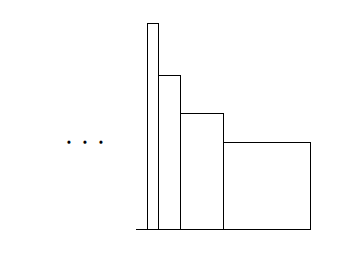
- Working from right-to-left, each rectangle is half the width and $4/3$ the height of the previous one.
- This means that the areas of the rectangles form a geometric progression, with first term $1$ and common ratio $2/3$.
- The sum to infinity of this geometric progression is $\displaystyle \frac{1}{1-\frac{2}{3}}=3$.
- The answer is (C).
Extension
- A function is defined for $x>0$ by \[g(x)=\left(\frac{1}{3}\right)^{|\,\lfloor \log_2(x)\rfloor \,|}.\] Note that $| \,\lfloor x \rfloor\, |$ is not the same thing as $\lfloor\, |x|\, \rfloor$. Find $\displaystyle \int_0^\infty g(x)\,\mathrm{d}x$.
Part of an Interview
- To sketch the graph, let's remember that when $x$ is very small, $\frac{a}{x}$ will be very large. On the other hand, when $x$ is very large, $\frac{a}{x}$ will be tiny, for any constant $a$ no matter how large it is (just wait until $x$ is a million times larger than $a$).
- So we're dealing with a graph that is large for small/large $x$ and has a minimum value somewhere in between.
The derivative is given by $f'(x)=\frac{1}{2}\left(1-\frac{a}{x^2}\right)$ and that's zero when $x=\sqrt{a}$. The turning point is at $(\sqrt{a},\sqrt{a})$.
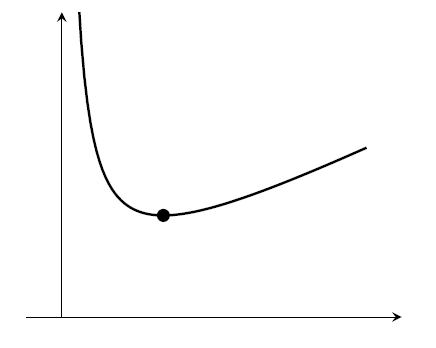
- When $x$ is very large, we could say that $f(x)$ grows like $x/2$, because the $a/x$ term is tiny and doesn't make much difference.
For $y=f(f(x))$, we still get large values of $y$ when $x$ is very small or very large. But now, we might reason that for very large $x$, the first $f$ will give us something like $x/2$ and then, since that's still large, the second $f$ will approximately halve again for something like $x/4$. So I'm going to draw a similar graph, but less steep for large values of $x$.
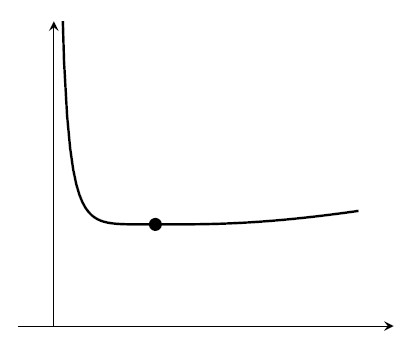
- The turning point is still at $(\sqrt{a},\sqrt{a})$. That point is clearly on the graph, following the value through both $f$s, and it's a minimum because we know that the values of the second $f$ can't be lower than $\sqrt{a}$.
- Now for the sequence, it's tempting to say that for a large value of $x$, the pattern of halving will keep going and the values will get close to zero. But on the other hand, we might realise that functions like $f(f(f(x)))$ and so on will all have minimum value $\sqrt{a}$. So the values of the sequence can't go below $\sqrt{a}$. It feels like maybe they decrease towards that value, but that needs a proof.
To prove the inequality $\displaystyle \left(f(x)-\sqrt{a}\right) < \frac{1}{2}\left(x-\sqrt{a}\right)$, let's plot the expressions on each side. For the expression on the left, I just need to translate my original graph down by $\sqrt{a}$. The expression on the right is a straight line.
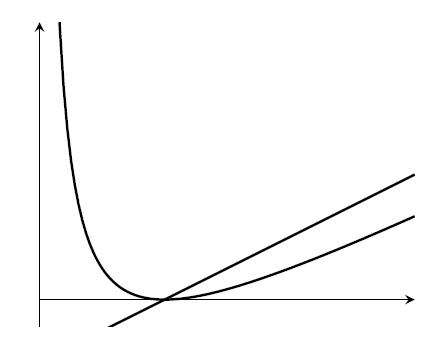
- It certainly looks like the function is growing less quickly than the straight line. This gives me the idea to compare the derivatives of each side; both expressions are zero when $x=\sqrt{a}$, so if I can prove that the function on the left grows slower, then its value will be lower than the expression on the right.
- It's not hard to check that, indeed, $\displaystyle \frac{1}{2}\left(1-\frac{a}{x^2}\right)<\frac{1}{2}$ for $x>\sqrt{a}$. The hard bit is to have the idea to even consider that, and the visualisation helps.
- What does this mean for the sequence? We've shown that the value of $f(x)$ is closer to $\sqrt{a}$ by a factor of $\frac{1}{2}$ or better. If we keep applying $f$ then this will keep happening; for any $x>\sqrt{a}$, applying $f$ ten times will give something that's at most $1/1024$ as far from $\sqrt{a}$. What we're doing here is bounding the sequence with a geometric progression. And you know what happens with a geometric progression. We'll eventually see values that are very close to $\sqrt{a}$.
- In fact, this sequence gets close to $\sqrt{a}$ really quickly once you're near. Depending on how the interview is going, we might prove that for $x>\sqrt{a}$, \[(f(x)-\sqrt{a})< K \left( x- \sqrt{a} \right)^2\] for some real constant $K$, and talk about what that means once the sequence is near to $\sqrt{a}$.
- As a demonstration, if we set $a=5$ and start with the number $3$ that's larger than $\sqrt{5}$, here are the values of the sequences. Decimals are shown to six decimal places
\(x\), \(f(x)\), \(f(f(x))\), \(f(f(f(x)))\) 3, \(\frac{ 7 }{ 3 }\), \(\frac{ 47 }{ 21 }\), \(\frac{ 2207 }{ 987 }\) 3.000000 2.333333 2.238095 2.236069 That last value is $\sqrt{5}$, correct to five decimal places.