


Graphs
Part of the Oxford Maths Admissions Test Livestream 2026
Solutions are available here
TMUA Specification (April 2025, Section 1 §MM8)
- Recognise and be able to sketch the graphs of common functions that appear in this specification: these include lines, quadratics, cubics, trigonometric functions, logarithmic functions, exponential functions, square roots, and the modulus function.
- Knowledge of the effect of simple transformations on the graph of $y = f(x)$ with positive or negative value of a as represented by:
- $y = af(x)$
- $y = f(x) + a$
- $y = f(x+a)$
- $y = f(ax)$
- Compositions of these transformations. Knowledge and use of the notation $f (g (x))$.
- Understand how altering the values of $m$ and $c$ affects the graph of $y = mx + c$.
- Understand how altering the values of $a$, $b$ and $c$ in $y = a(x+b)^2 + c$ affects the corresponding graph.
- Use differentiation to help determine the shape of the graph of a given function, including:
- finding stationary points (excluding inflexions)
- when the graph is increasing or decreasing
- Use algebraic techniques to determine where the graph of a function intersects the coordinate axes; appreciate the possible numbers of real roots that a general polynomial can possess.
- Geometric interpretation of algebraic solutions of equations; relationship between the intersections of two graphs and the solutions of the corresponding simultaneous equations.
Revision
- The graph of an equation involving $x$ and $y$ is all the points in the $(x,y)$ plane that satisfy the equation. For a function $f(x)$, the graph of $y=f(x)$ shows the value of $f$ at each value of $x$.
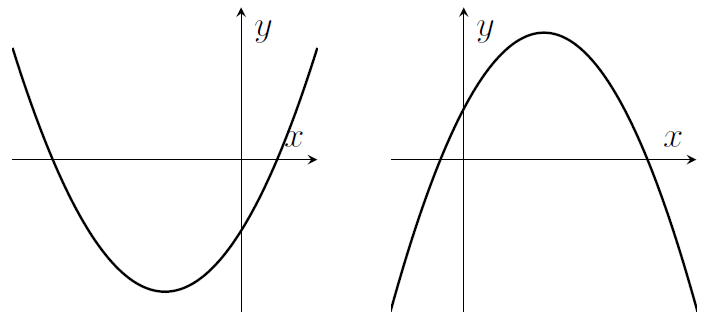
- Quadratics $y=ax^2+bx+c$ have graphs like these
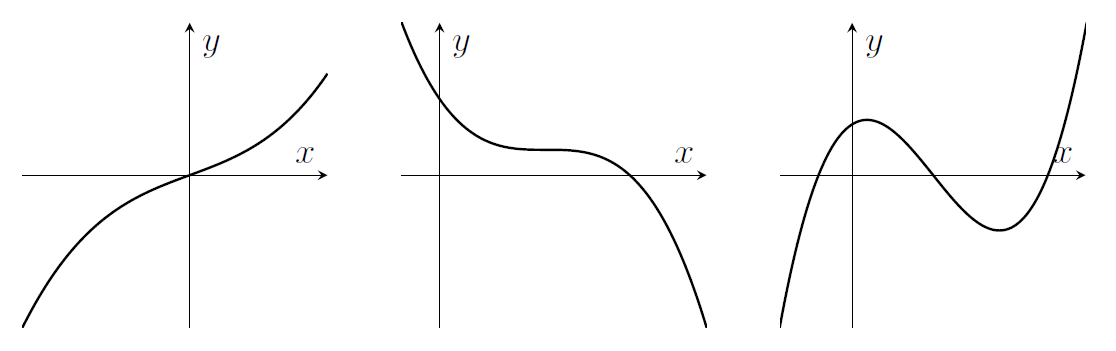
- Cubics $y=ax^3+bx^2+cx+d$ can have 0 or 1 or 2 stationary points.
- Other polynomials have graphs that might have more stationary points; up to $(n-1)$ of them for a polynomial of degree $n$.
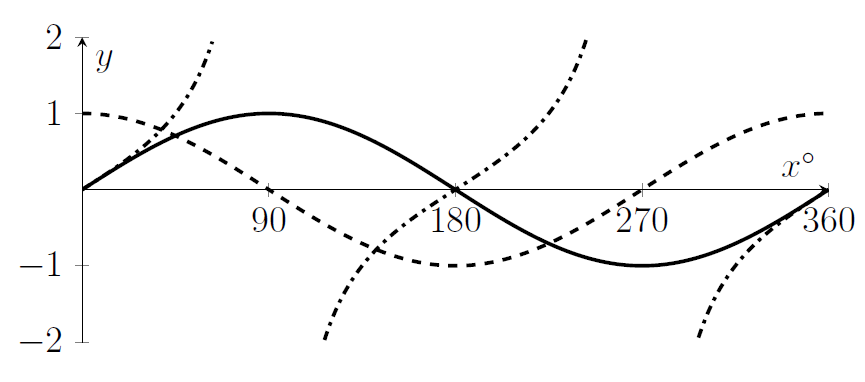
- Graphs of $y=\sin x$ (solid line) and $y=\cos x$ (dashed line) and $y=\tan x$ (dot-dashed line);
Here are some graphs of exponential functions $a^x$ and the logarithmic function $\log_a x$. Note that $\log_a x$ is very negative for $x$ close to zero, if $a>1$.
$y=a^x$ with $a>1$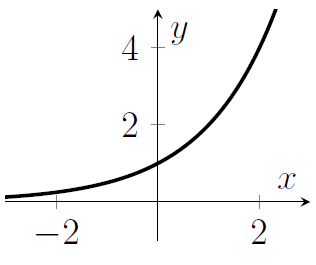
$y=a^x$ with $0< a<1$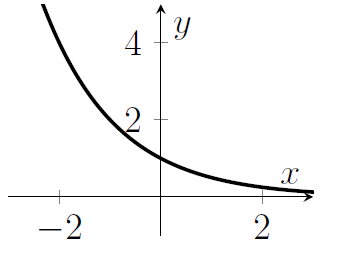
$y=\log_a x$ with $a>1$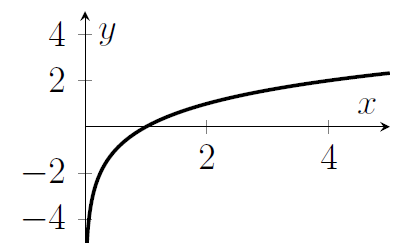
Here are graphs of the square root function $\sqrt{x}$ and the modulus function $|x|$. For $\sqrt{x}$, note that $\sqrt{x}=x^{1/2}$ so the derivative is $\frac{1}{2}x^{-1/2}$, which gets arbitrarily large near $x=0$.
$y=\sqrt{x}$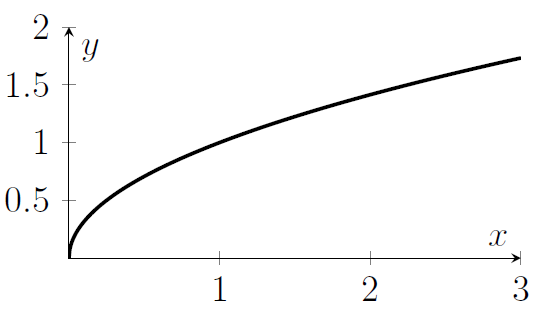
$y=|x|$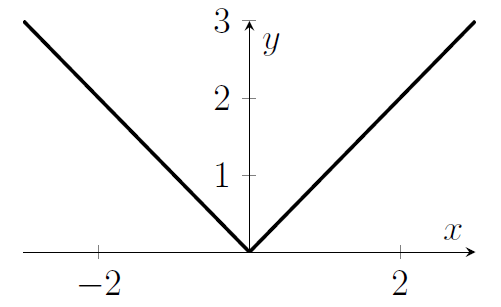
- The graph of $y=f(x-a)$ is the translation of the graph of $y=f(x)$ by a distance $a$ in the positive $x$-direction.
- The graph of $y=f(x)+a$ is the translation of the graph of $y=f(x)$ by a distance $a$ in the positive $y$-direction.
- The graph of $y=f(ax)$ is a stretch of the graph of $y=f(x)$ by a factor of $\frac{1}{a}$ parallel to the $x$-axis. If $a=-1$ then the transformation is a reflection in the $y$-axis. If $a$ is some other negative number then the transformation is a combination of that reflection and a stretch parallel to the $x$-axis.
- The graph of $y=af(x)$ is a stretch of the graph of $y=f(x)$ by a factor of $a$ parallel to the $y$-axis. If $a=-1$ then the transformation is a reflection in the $x$-axis. If $a$ is some other negative number then the transformation is a combination of that reflection and a stretch parallel to the $y$-axis.
- If you do two or more transformations then (depending on the transformations) the order in which you do them might matter.
- The notation $f(g(x))$ means that we take the value of $x$, apply the function $g$, and then apply the function $f$ to that result. So if $f(x)=x^2$ and $g(x)=x+1$ then $f(g(x))=(x+1)^2$. The brackets are supposed to help, but note that sometimes people write $fg(x)$ to mean $f(g(x))$.
- Recall that you can use differentiation to find the stationary points of a curve $y=f(x)$, and to find out whether the function is increasing or decreasing.
- If you want to find the points where the graph of a function $y=f(x)$ intersects the $x$-axis, then you need to find the solutions to $f(x)=0$. If there are no solutions then there are no such points.
- If you want to find the point where the graph of a function $y=f(x)$ intersects the $y$-axis, then you just need to calculate $f(0)$. If this is not defined then there is no such point.
- A polynomial with degree $n$ has at most $n$ real roots.
- If you have two equations, you could graph the points that satisfy each equation and look for points that lie on both graphs. Any such point satisfies both equations simultaneously.
Revision Questions
- Let $f(x)=x^2+4x+3$. Sketch the graph of $y=f(x+2)$.
Sketch the graph of $y=3 f( 2 x)$.
Sketch the graph of $y=2 f( 3 x)$. Is that the same as the previous graph?
Give an example of a function $g(x)$ such that $y=5g(4x)$ and $y=4g(5x)$ have the same graph. - Let $f(x)=x^3-x$. Sketch the graph of $y=2f(x+1)$.
Sketch the graph of $y=2f(x)+1$. Is that the same as the previous graph?
Give an example of a function $g(x)$ such that $y=3g(x)+2$ and $y=3g(x+2)$ have the same graph. - Sketch the graph of $y=x^n$ for various values of $n$; large, small, or negative.
- Sketch the graph of $\sqrt{4x+1}$ for $x \geq -\frac{1}{4}$.
- Sketch the graph of $y=\sqrt{x^2}$.
- Sketch the graph of $y=\sin(x^2)$.
- Sketch the graph of $y=\log_2 x$. Sketch the graph of $y=\log_2 (x^2-2x+1)$.
- Sketch the graphs of $y=2^x$ and $y=\left(\frac{1}{2}\right)^{x}$ on the same axes. Describe the relationship between the graphs.
- Sketch the graph of $\displaystyle y=\frac{1}{2} + \frac{1}{2}\cos 2x$.
- Sketch all the points $(x,y)$ that satisfy $y=4-x$.
Sketch all the points $(x,y)$ that satisfy $y=4-x^2$.
Sketch all the points $(x,y)$ that satisfy $y^2=4-x^2$. - Let $f(x)=\cos x$. Sketch all the points $(x,y)$ that satisfy $f(x)=f(y)$.
- Let $f(x)=x^3-x$. Sketch all the points $(x,y)$ that satisfy $f(x)=f(y)$.
- Sketch all the points $(x,y)$ that satisfy $x^4+2x^2y^2+y^4-3x^2-3y^2+2=0$.
- Sketch all the points $(x,y)$ that satisfy $x^6+3x^4y^2+3x^2y^4+y^6=1$.
- Sketch all the points $(x,y)$ that satisfy $xy+x^2y^2=x^3+y^3$.
TMUA Questions
TMUA 2020 Paper 2 Question 5
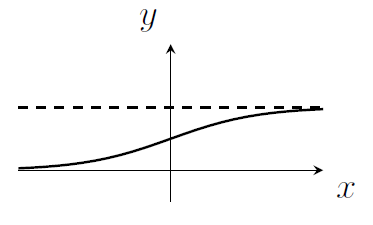
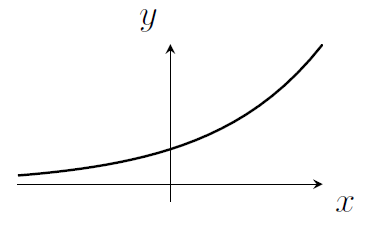
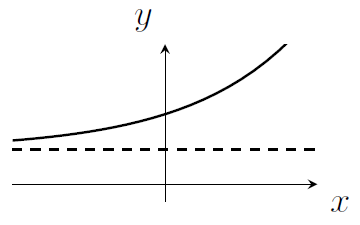
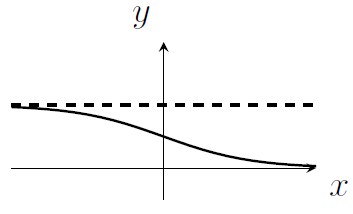
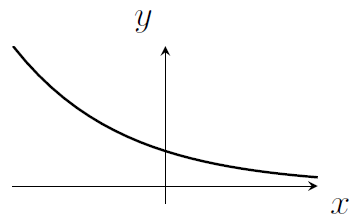
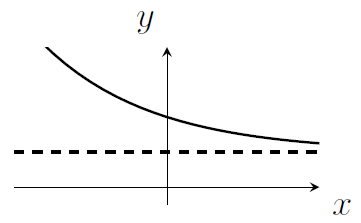
Which one of the following shows the graph of \[ y = \frac{2^x}{1 + 2^x} \] (Dotted lines indicate asymptotes.)
(A)
(B)
(C)
(D)
(E)
(F)
[Scroll down for hints]
TMUA 2021 Paper 2 Question 13
A region $R$ in the $(x,y)$-plane is defined by the simultaneous inequalities \[ y - x < 3 \] \[ y - x^2 < 1 \] Which of the following statements is/are true for every point in $R$?
I $-1 < x < 2$
II $(y-x)(y-x^2) < 3$
III $y < 5$
(A) none of them
(B) I only
(C) II only
(D) III only
(E) I and II only
(F) I and III only
(G) II and III only
(H) I, II and III
[Scroll down for hints]
TMUA 2021 Paper 1 Question 17
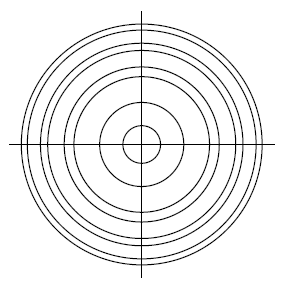
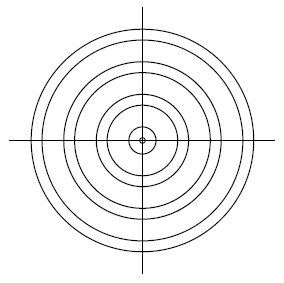
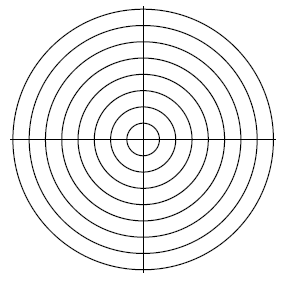
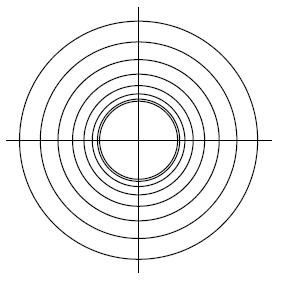
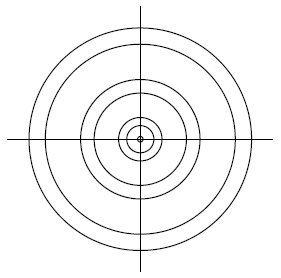
Which of the following sketches shows the graph of \[ \sin(x^2 + y^2) = \frac{1}{2} \] where $x^2 + y^2 \le 8\pi$?
[This question uses radians]
(A)
(B)
(C)
(D)
(E)
[Scroll down for hints]
TMUA 2021 Paper 1 Question 18
The curve with equation \[ x = y^2 - 6y + 11 \] is rotated $90^\circ$ clockwise about the point $P$ to give the curve $C$.
$P$ has $x$-coordinate $-2$ and $y$-coordinate $3$.
What is the equation of $C$?
(A) $y = -x^2 - 4x - 3$
(B) $y = -x^2 - 4x - 5$
(C) $y = -x^2 - 6x - 7$
(D) $y = -x^2 - 6x - 11$
(E) $y = \phantom{-}x^2 - 4x + 5$
(F) $y = \phantom{-}x^2 + 4x + 3$
(G) $y = \phantom{-}x^2 - 6x + 11$
(H) $y = \phantom{-}x^2 + 6x + 7$
[Scroll down for hints]
TMUA 2022 Paper 1 Question 10
A sequence of translations is applied to the graph of $y = x^3$
Which of the following graphs could be the result of this sequence of translations?
I $y = x^3 - 3x^2 + 9x - 27$
II $y = x^3 - 9x^2 + 27x - 3$
III $y = 27x^3 - 9x^2 + x - 3$
(A) none of them
(B) I only
(C) II only
(D) III only
(E) I and II only
(F) I and III only
(G) II and III only
(H) I, II and III
[Scroll down for hints]
TMUA 2022 Paper 1 Question 18
It is given that \[ \mathrm{f}(x) = x^2(x-1)^2(x-2) \] \[ \mathrm{g}(x) = -p(x-q)^2(x-r)^2 \] where $p$, $q$ and $r$ are positive and $q < r$
Find the set of values of $q$ and $r$ that guarantees the greatest number of distinct real solutions of the equation $\mathrm{f}(x) = \mathrm{g}(x)$ for all $p$.
(A) $q < 1$ and $r < 1$
(B) $q < 1$ and $1 < r < 2$
(C) $q < 1$ and $r > 2$
(D) $1 < q < 2$ and $1 < r < 2$
(E) $1 < q < 2$ and $r > 2$
(F) $q > 2$ and $r > 2$
[Scroll down for hints]
Hints
TMUA 2020 Paper 2 Question 5
- Think about the approximate value of $y$ when $|x|$ is very large, considering the cases $x>0$ and $x<0$ separately.
- You might find it helpful to define $\displaystyle f(x)=\frac{x}{1+x}$ and $g(x)=2^x$, thinking of the graph in the question as $y=f(g(x))$.
TMUA 2021 Paper 2 Question 13
- Sketch a graph of $y-x=3$ and a graph of $y-x^2=1$ on the same axes.
- Find the point(s) where those graphs cross the axes or each other.
- Think carefully about which regions obey each of the inequalities and therefore which region is $R$.
- For I and III, we're being asked if the region is bounded by particular horizontal / vertical lines. Now that you've got a sketch, do you agree that all points in $R$ are bounded by such lines?
- For II, remember that multiplying inequalities is "dangerous". Note that a single counterexample (a point in $R$ that does not satisfy this inequality) would be enough to show that it is not true for every point in $R$.
TMUA 2021 Paper 1 Question 17
- You know solutions for $x$ such that $\sin x = \frac{1}{2}$. In this question, those solutions will give different parts of the graph.
- What would a graph look like if $x^2+y^2$ were some constant?
- If the constant $c$ increases steadily, what happens to $\sqrt{c}$?
TMUA 2021 Paper 1 Question 18
- Sketch the curve with equation $x=y^2-6y+11$, and mark the point $P$ on your sketch.
- The curve is a parabola, and after rotation we might expect a parabola.
- Sketch the graph that you expect after a $90^\circ$ clockwise rotation about $P$.
- Describe the relationship between the initial graph and the point $P$, and then describe the relationship between the new graph and the point $P$.
- If we can identify the location of the turning point of the new graph, then that is (almost) good enough!
TMUA 2022 Paper 1 Question 10
- The effect of "a sequence of translations" is not as complicated as it sounds. Do not write out a sequence like $T_1$, $T_2$, ... for the translations. Think about what the overall effect could be.
- What happens to the equation $y=x^3$ if you translate parallel to the $x$-axis by $a$ units and then translate parallel to the $y$-axis by $b$ units?
- For each of I, II, and III, we must decide whether it's possible for such an equation to be the result of such a transformation. We could try to solve for $a$ and $b$ in each case.
TMUA 2022 Paper 1 Question 18
- Both $\mathrm{f}(x)$ and $\mathrm{g}(x)$ are polynomials. The "greatest number of distinct real solutions" of the equation $\mathrm{f}(x)= \mathrm{g}(x)$ is something to do with the degrees of these polynomials.
- Sketch $y=\mathrm{f}(x)$, which does not depend on $p$ or $q$ or $r$.
- Imagining for a moment that $p=1$, separately sketch $y=-(x-q)^2(x-r)^2$. What is the effect of changing $p$ to some other positive real number?
- We're being asked whether we would like the roots of $\mathrm{g}(x)$ to be between the roots of $\mathrm{f}(x)$ or not. Our aim is to make sure that, for any value of $p$, the number of crossings between $\mathrm{f}$ and $\mathrm{g}$ is as high as it could be, independent of the value of $p$.
- What happens when $x$ is very negative? Which of the two functions has the more negative value?
- A crossing is guaranteed if there's a change of sign from $\mathrm{f}(x)<\mathrm{g}(x)$ to $\mathrm{f}(x)>\mathrm{g}(x)$ in some region.