


Graphs Solutions
Part of the Oxford Maths Admissions Test Livestream 2026
These are the solutions for the Graphs worksheet
Revision Questions
- Note that $x^2+4x+3=(x+3)(x+1)$. The graph of $y=f(x+2)$ is the graph of $y=f(x)$ after it has been translated two units to the left.
$f(x)$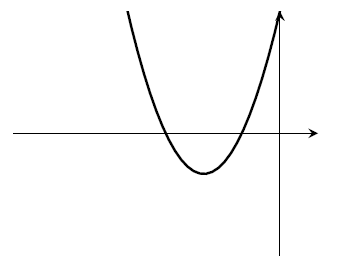
$f(x+2)$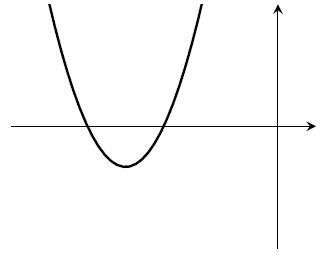
For $y=3f(2x)$, the graph is "squashed" by a factor of 2 parallel to the $x$-axis, then "stretched" by a factor of 3 parallel to the $y$-axis.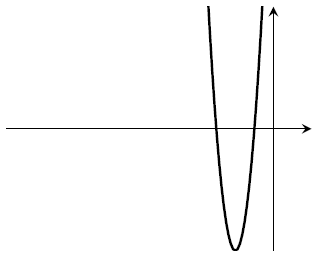
For $y=2 f( 3 x)$, the graph is squashed by a factor of 3 parallel to the $x$-axis, then stretched by a factor of 2 parallel to the $y$-axis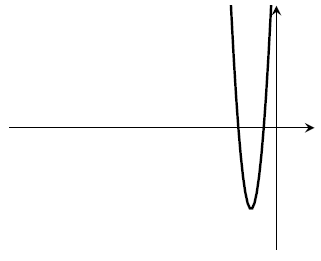
It's not the same as the previous graph. For example, the roots aren't in the same places.
$g(x)=x$ works for the last part; then $y=20x$ in both cases. - The graph of $y=f(x)$ and the graph of $y=2f(x+1)$;
$f(x)=x^3-x$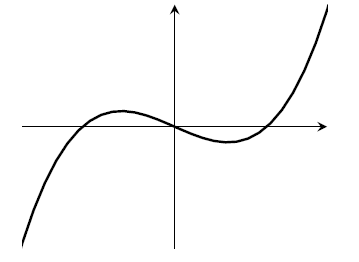
$2f(x+1)$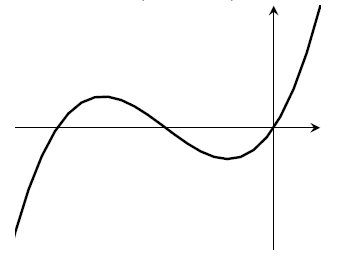
The graph of $y=2f(x)+1$;
$2f(x)+1$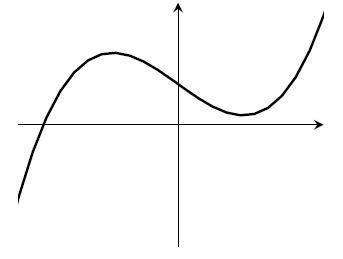
It's not the same as the previous graph. We could compare, for example, the values of $2f(x+1)$ and $2f(x)+1$ when $x=0$.
$g(x)=x/3+c$ for any constant $c$ works for the last part. - For large $n$, $y=x^n$ is close to zero between $-1$ and $1$, except for values near $x=\pm 1$. For small positive $n<1$, $y=x^n$ is close to $1$ between $0$ and $1$, except for values near $x=0$. For negative $n$, the graph increases without bound near $x=0$.
$y=x^9$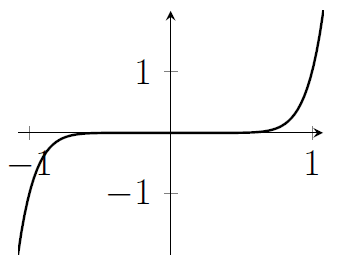
$y=x^{1/5}$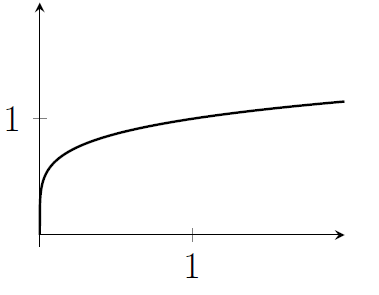
$y=x^{-1/2}$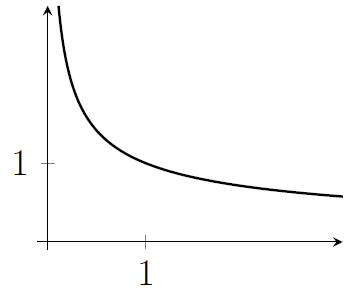
- Note that $\sqrt{4x+1}=2\sqrt{x+\frac{1}{4}}$ so this is a translation of the graph of $y=\sqrt{x}$ by $\frac{1}{4}$ units in the negative $x$-direction followed by a stretch parallel to the $y$-axis with scale factor 2.
$y=\sqrt{4x+1}$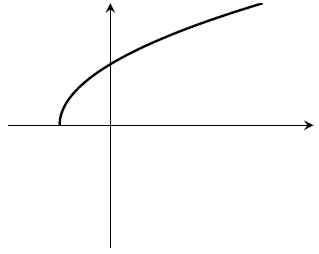
- If $x\geq0$ then $\sqrt{x^2}=x$ but if $x<0$ then $\sqrt{x^2}=-x$, because $\sqrt{u}$ is always the non-negative root.
$y=\sqrt{x^2}$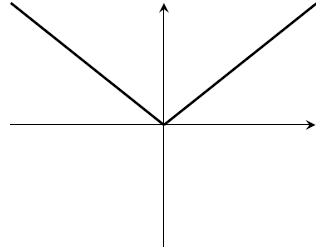
- The function $\sin(x^2)=0$ when $x^2= 180^\circ n$ for $n$ an integer, so the graph crosses the $x$-axis more and more frequently as $x$ increases. The graph has reflectional symmetry in the $y$-axis.
$y=\sin(x^2)$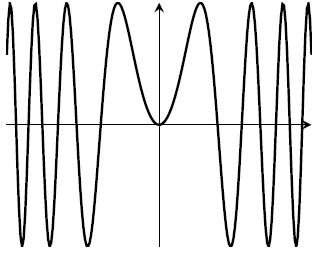
- Note that $\log_2(x^2-2x+1)=\log_2((x-1)^2)$. For $x>1$ this is just $2\log_2(x-1)$. For $x<1$, it is $2\log_2 (-(x-1))$, because for negative $x$, $\sqrt{x^2}=-x$.
$y=\log_2 x$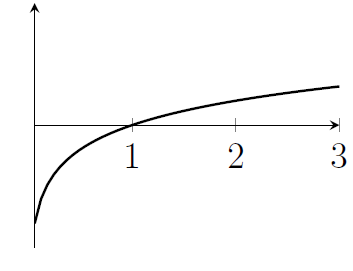
$y=\log_2 (x^2-2x+1)$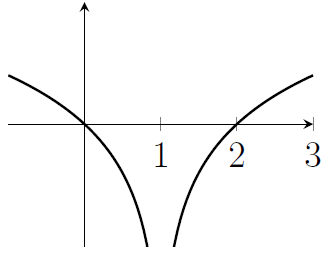
- The graph of $y=2^x$, and the graph of $y=2^{-x}$.
$y=2^x$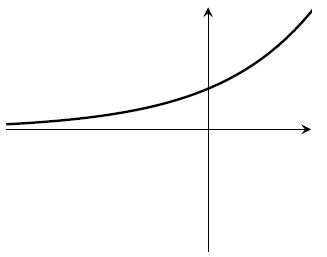
$y=2^{-x}$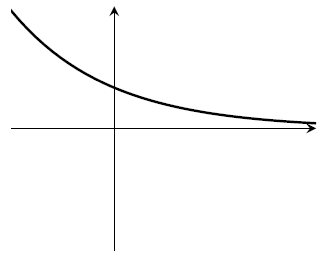
Each graph is the reflection in the $y$-axis of the other graph. - The graph of $y=\frac{1}{2} + \frac{1}{2}\cos 2x$ is related to the graph of $y=\cos x$ by a stretch parallel to the $x$-axis with scale factor $\frac{1}{2}$, a stretch parallel to the $y$-axis with scale factor $\frac{1}{2}$, and then a translation parallel to the $y$-axis by $\frac{1}{2}$ a unit. After those transformations, the local minima of $\cos x$ will be transformed to be on the $x$-axis.
$\cos x$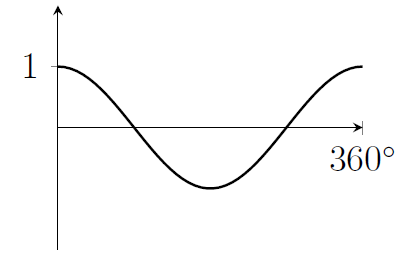
$\frac{1}{2}+\frac{1}{2}\cos 2x$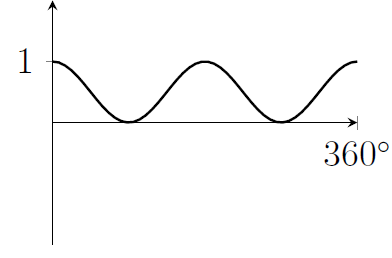
- The equation $y=4-x$ is the equation of a straight line.
The equation $y=4-x^2$ is the equation of a parabola.
The equation $y^2=4-x^2$ is the equation of a circle with radius 2 centred on the origin.
$y=4-x$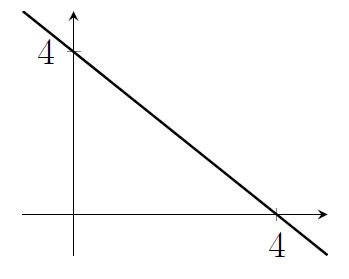
$y=4-x^2$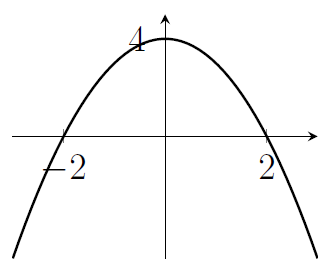
$y^2=4-x^2$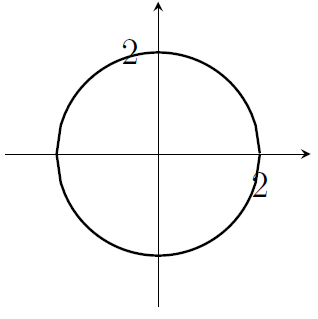
- If $\cos x = \cos y$ then either $x=y+360^\circ n$ for some integer $n$, or $x=-y+360^\circ n$ for some integer $n$. These are the equations of straight lines.
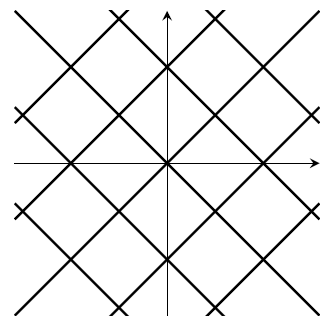
- It's helpful to consider different values of the function separately. Let's suppose that $f(x)=c$ and $f(y)=c$ for some particular value of $c$.
If $c$ is large enough then there is just one input to $f$ that gives the output $c$, so we must have $x=y$. In fact, it's always possible that $x=y$, so that line is part of our graph.
For some values of $c$ though, there are three possible inputs to $f$ that give that output. As we change $c$, these alternative solutions appear at the turning point of $y=f(x)$. In terms of $x$ and $y$, these solutions trace out a neat round graph. That part of the graph is actually an ellipse, but you are not expected to spot that!
Algebraically, if $x^3-x=y^3-y$ then we can rearrange for $x^3-y^3-x+y=0$ and factorise for $(x-y)(x^2+xy+y^2-1)$. You are not expected to know that $x^2+xy+y^2=1$ is the equation of an ellipse.
$y=f(x)$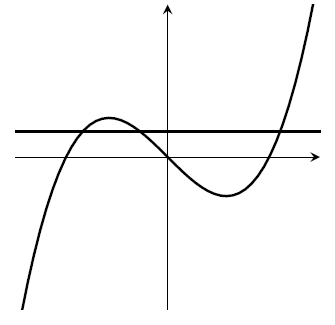
$f(x)=f(y)$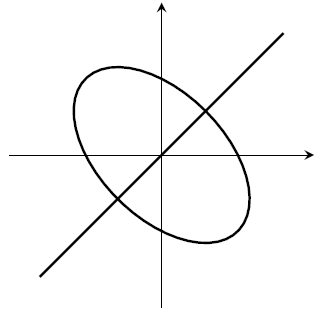
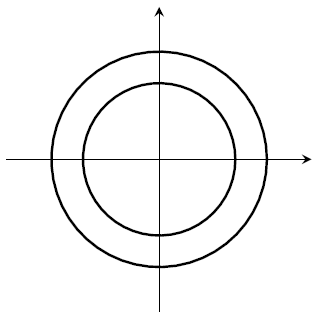
- The equation $x^4+2x^2y^2+y^4-3x^2-3y^2+2=0$ simplifies to $(x^2+y^2)^2-3(x^2+y^2)+2=0$, which is a quadratic for $x^2+y^2$, with roots $x^2+y^2=1$ or $x^2+y^2=2$. This is a pair of circles.
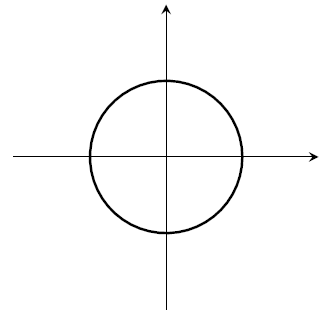
- The equation $x^6+3x^4y^2+3x^2y^4+y^6=1$ simplifies to $(x^2+y^2)^3=1$ so we have $x^2+y^2=1$ and this is a circle.
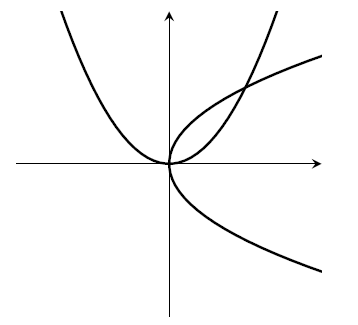
- The equation rearranges to $x^3-xy=x^2y^2-y^3$. Take out a factor of $x$ on the left and $y^2$ on the right to factorise this as $x(x^2-y)=y^2(x^2-y)$. So either $x^2=y$ or $x=y^2$. This is a pair of parabolas.
TMUA Questions
TMUA 2020 Paper 2 Question 5
- The function involves $2^x$ twice, so I'd like to think about what happens to $2^x$ for different values of $x$.
- If $x$ is very large and positive, $2^x$ is very large indeed. What does that tell me about the graph? Informally, I'll have $y=\dfrac{\text{large}}{1+\text{large}}$. That's about 1.
- For very negative $x$, $2^x$ is about 0. What does that tell me about the graph? I'll have $y\approx 0$.
- When $x=0$, I get $\displaystyle \frac{1}{1+1}=\frac{1}{2}$. Halfway in between.
- I also sketched $\displaystyle y=\frac{u}{1+u}$, just to check my understanding. This is an increasing function of $u$ for $u>-1$.
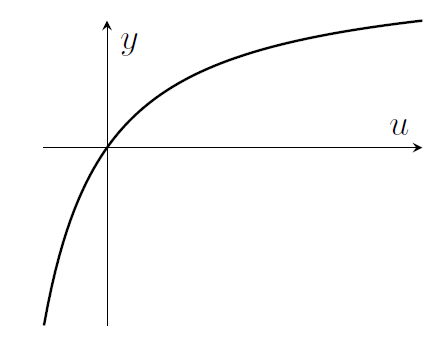
- Asymptotes are not mentioned on the TMUA Content Specification, but the idea is that, if $f(x)$ approaches a value for large $|x|$ (either very positive or very negative), then we can draw a horizontal dotted line with that value, if we want to. You've maybe met this idea for graphs like $\displaystyle y=\frac{1}{x}$ which we say has a horizontal asymptote at $y=0$, thinking about the behaviour of $y$ for very large $x$.
- The graph in this question has a horizontal asymptote at $y=1$, thinking about the values when $x$ is very large, and it also has a horizontal asymptote at $y=0$, thinking about the values when $x$ is very negative.
- The answer is A.
Extension
- Let $\displaystyle \mathrm{f}(x)= \frac{2^x}{1+2^x}$. Prove that $\mathrm{f}(-x)=1-\mathrm{f}(x)$.
Interpret this as a symmetry of the graph of $y=\mathrm{f}(x)$. - True or false? "If $\mathrm{f}(x)$ is increasing and $\mathrm{g}(x)$ is increasing, then $\mathrm{f}(\mathrm{g}(x))$ is increasing."
- True or false? "If $\mathrm{f}(x)$ is decreasing and $\mathrm{g}(x)$ is decreasing, then $\mathrm{f}(\mathrm{g}(x))$ is decreasing."
TMUA 2021 Paper 2 Question 13
- I sketched $y-x=3$ and $y-x^2=1$ on the same axes.
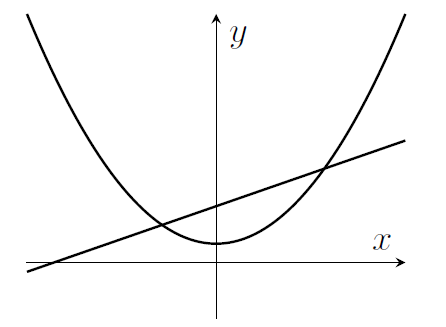
- I had to think hard about the inequalities. Which region do I want? The region that's "below" both curves, I think, because I can re-write each of them as $y<[\text{something}]$.
- It's strange to me that $y$ can go very negative; when I drew the curves I was expecting $R$ to be the finite region bounded between the curves (possibly because I'm used to integration questions that ask me to find the area of such a region).
- The first inequality asks us whether the values of $x$ are limited for every point in $R$. No, $x$ can be very negative. At this point I went back to look at the inequalities very carefully, because this is precisely the sort of inequality that I'd get if $R$ were the finite region between the curves. It's not though.
- II looks like a trap to me; I can see why you might think that this is true, by multiplying the inequalities together. But we know that this can go wrong, if both brackets are negative. Can I actually do that for the region $R$? Yes if I move away from the curves far enough, I think. Looking for a counter-example, I'll set $x=0$ and then I'm looking for $y$ such that $y<3$ and $y<1$ (to obey the given inequalities) and also $y^2 \geq 3$ (to contradict II). I'll set $y=-2$. One counter-example $(0,-2)$ is enough to disprove II.
- III asks whether the values of $y$ are limited. No, $y$ can be large. Again, this is the sort of inequality that I might get if $R$ were the finite region between the curves. It's still not though.
- None of them are true.
- The answer is A.
Extension
- Change $y-x^2<1$ to $y-x^2>1$. Which of I, II, III is/are true for every point in $R$?
- If I were using this as the start of an interview question, then I might build towards a sketch of graph of $(y-x)(y-x^2)=3$. We might start by exploring how many points are on that graph for each value of $x$. For large $x$, what are the approximate values of $y$ (in terms of $x$) for those points?
TMUA 2021 Paper 1 Question 17
- I'll want $x^2+y^2$ to be equal to $\displaystyle \frac{\pi}{6}$ or $\displaystyle \frac{5\pi}{6}$, or one of those plus $2\pi$ or $4\pi$, or so on.
- Those are concentric circles (the centre is the origin) with different radii.
- Since $x^2+y^2=r^2$ for a circle, the radius is the square root of each of the numbers I listed above.
- These solutions for $r^2$ come in pairs, with a gap of $\displaystyle \frac{4\pi}{6}$ between the two solutions in the pair.
- Thinking about the radius $r$ instead of $r^2$, I would like to take the square root of those numbers. What will happen to the gap between a pair of solutions?
- Because the graph of $y=\sqrt{x}$ grows at a slower rate for larger values of $x$, if we look at a larger pair of solutions for $r^2$, then the gap between the values of $r$ will be smaller than it would have been for a smaller pair.
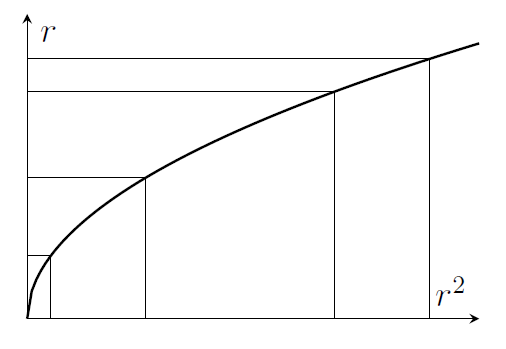
- So I'm expecting pairs of circles, with a gap between the pair that decreases the further from the origin I look.
- Options B and E have equally-spaced pairs.
- Option C doesn't seem to have pairs, or any change in the gaps.
- I have no idea what's going on with option D, but I don't like it.
- Option A seems to fit the description above.
- The answer is A.
Extension
- Check your understanding; sketch the solutions to $\cos\left(x^2+y^2\right)=\frac{1}{2}$.
- If I were using this as the start of an interview question, then next I might switch to a different function entirely, and ask you about the graph \[\left(x^2+y^2\right)^{1/2}\sin\left(x^2+y^2\right)=1.\]
TMUA 2021 Paper 1 Question 18
- I drew a graph. This is a "sideways" parabola where the roles of $x$ and $y$ have been swapped compared with the usual parabolas I've seen before. For some values of $x$ there are no points on the graph, for some values there are two solutions for $y$ from the quadratic formula, and for one value of $x$ there's a single value of $y$ on the graph.
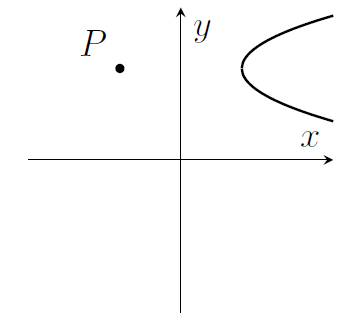
- I can complete the square to find $x=(y-3)^2+2$, so the turning point (if we can call it that, the parabola is sideways!) is at $(2,3)$.
- Nice, that turning point is on the same horizontal line as the point $P$.
- So after rotation the turning point will be directly below $P$, a distance of 4 away, the same distance as before the rotation.
- I drew a sketch of this. I've drawn a parabola for the new curve (partly because all the options are parabolas), and I've drawn it with a negative leading coefficient (pointing downwards).
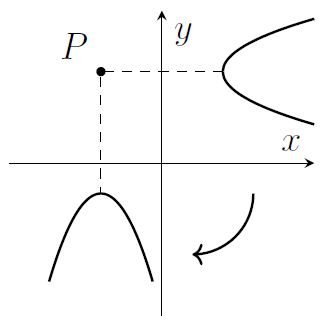
- The leading term of the quadratic will probably be $-x^2$, looking at my sketch and looking at the options.
- Then, for the turning point to be at $(-2,-1)$, it will need to be $y=-(x+2)^2-1$.
- Expand that out for $y=-x^2-4x-5$.
- The answer is B.
Extension
- Check your understanding; suppose that the original curve was $x=(y-2)^2+2$ instead.
- You don't have to know this, but in general the way to rotate a graph by 90 degrees clockwise about the origin is to replace $x$ with $(-y)$ and, simultaneously, replace $y$ with $x$. How can you use this fact to do this question, where the rotation is not about the origin?
TMUA 2022 Paper 1 Question 10
- A sequence of translations is just one big translation... or perhaps I should say one big translation parallel to the $x$-axis and one big translation parallel to the $y$-axis.
- So after all of that, the graph $y=x^3$ will be transformed to $y=(x-a)^3+b$.
- That's everything that I can make with translations!
- I'd like to multiply that out and compare it to the graphs in the question. If they're not in that form, then I can't make them with my translations (if they are then I probably can, but I will be careful and make sure that I can solve for $a$ and $b$)
- Multiplying out gives $y=x^3-3ax^2+3a^2x-a^3+b$.
- So III is out straight away, because the coefficient of $x^3$ doesn't match.
- For I, to get the coefficients to match, we would need $-3=-3a$ and $9=3a^2$ and also something involving $-27$ and $b$. But there's no value of $a$ that satisfies both of those equations, so no translation will give this graph.
- For II, to get the coefficients to match, we would need $-9=-3a$ and $27=3a^2$... so we're off to a good start because $a=3$ works for both of those... and also $-3=-a^3+b$. I could solve for $b=24$ if I wanted to.
- So I can get the graph of II (translate 3 units parallel to the $x$-axis and then $24$ units parallel to the $y$-axis).
- The answer is C.
Extension
- An alternative method that I considered when I read this question was "look to see if there is a point with both $\displaystyle \frac{\mathrm{d}y}{\mathrm{d}x}=0$ and $\displaystyle \frac{\mathrm{d}^2y}{\mathrm{d}x^2}=0$". Would this work? If yes, retry the question with this method. If not, refine this method and then retry the question.
- Find a necessary and sufficient condition involving $A$ and/or $B$ and/or $C$ such that there is a sequence of translations that takes the graph $y=x^3$ to the graph \[y=x^3+Ax^2+Bx+C.\]
- Find a sequence of translations and/or stretches parallel to the axes that takes the graph $y=x^3$ to graph III.
- Explain why there is no sequence of translations and/or stretches parallel to the axes that takes the graph $y=x^3$ to graph I.
- Find necessary and sufficient conditions involving $A$ and/or $B$ and/or $C$ and/or $D$ such that there is a sequence of translations and/or stretches parallel to the axes that takes the graph $y=x^3$ to the graph \[y=Dx^3+Ax^2+Bx+C.\]
TMUA 2022 Paper 1 Question 18
- I started by sketching $y=\mathrm{f}(x)$. This polynomial has degree 5, and it has repeated roots at $x=0$ and at $x=1$. There is a root at $x=2$. The values are positive for $x>2$ only.
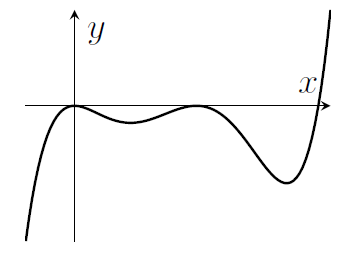
- I don't want to work out where the turning points are precisely, so I'll just draw something with the roots in the right place, and I'll try to remember that I haven't checked the size of the values of $\mathrm{f}(x)$ away from the $x$-axis.
- Next I sketched $y=\mathrm{g}(x)$. I can see that changing $p$ will just stretch the graph parallel to the $y$-axis, so I'll ignore that for now. This polynomial has degree 4 and has repeated roots at $x=q$ and at $x=r$.
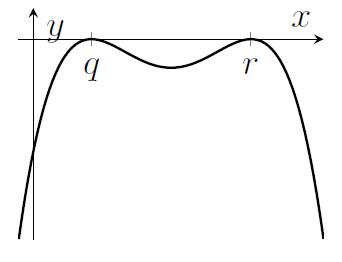
- I'm interested in places where the graphs cross. Thinking about $x<0$, I'd like to know whether I'll get a crossing there. I know that $\mathrm{f}(0)=0$ and $\mathrm{g}(0)<0$, so the question is whether $\mathrm{f}(x)$ "catches up" and becomes more negative than $\mathrm{g}(x)$ as $x$ gets very negative. This will happen, because the degree of $\mathrm{f}$ is larger.
- What is the "greatest number of distinct real solutions"? I suppose that the equation $\mathrm{f}(x)=\mathrm{g}(x)$ can be rearranged to a polynomial equation $\mathrm{h}(x)=0$ where $\mathrm{h}(x)=\mathrm{f}(x)-\mathrm{g}(x)$. That has degree 5, so the equation has at most 5 real solutions.
- Can I choose $q$ and $r$ to guarantee four more distinct real solutions? Yes, if I make the graphs cross a lot!
- If I put the turning point of $\mathrm{g}(x)$ at $q$ between $x=0$ and $x=1$, then I'll get two solutions, one between $0$ and $q$, and one between $q$ and $1$. Similarly, if I put the other turning point of $\mathrm{g}(x)$ between $x=1$ and $x=2$, then I'll get two more solutions over there.
- This works for all $p$ because, for any value of $p$, the graphs really will cross in those intervals. In the cases given for the other options, changing $p$ might move the graph of $\mathrm{g}(x)$ away from the graph of $\mathrm{f}(x)$ in that region.
- The answer is B.
Extension
- For option C, find the minimum number of distinct real solutions as $p$ changes.