Graphs
This resource is part of the 2025 archive of the Oxford MAT Livestream. Click or tap here or on the image below for the new and updated livestream admissions support programme from Oxford Mathematics.

MAT syllabus
The graphs of quadratics and cubics. Graphs of
\begin{equation*}
\sin x, \quad \cos x, \quad \tan x, \quad \sqrt{x}, \quad a^x ,\quad \log_a x.
\end{equation*}
Solving equations and inequalities with graphs.
The relations between the graphs
\begin{equation*}
y = f (ax),\quad y = af (x),\quad y = f (x - a), \quad y = f (x) + a
\end{equation*}
and the graph of $y = f (x)$.
Revision
- The graph of an equation involving $x$ and $y$ is all the points in the $(x,y)$ plane that satisfy the equation. For a function $f(x)$, the graph of $y=f(x)$ shows the value of $f$ at each value of $x$.
- Quadratics $y=ax^2+bx+c$ have graphs like these

- Cubics \(y=ax^3+bx^2+cx+d\) can have 0 or 1 or 2 stationary points.
. The middle one falls (reaching a moment of flatness in the middle). The right one rises then falls then rises again.")
- Other polynomials have graphs that might have more stationary points (up to $(n-1)$ turning points if $x^n$ is the highest power of $x$ in the polynomial)
- Graphs of $y=\sin x$ (red solid line) and $y=\cos x$ (green dashed line) and $y=\tan x$ (blue dot-dashed line);

- Here are some more graphs. Note that $\sqrt{x}=x^{1/2}$ so the derivative is $\frac{1}{2}x^{-1/2}$, which gets arbitrarily large near $x=0$.

- Here's a graph of $\log_a x$ with $a>1$. Note that $\log_a x$ is very negative for $x$ close to zero.

- The graph of $y=f(x-a)$ is the translation of the graph of $y=f(x)$ by a distance $a$ in the positive $x$-direction.
- The graph of $y=f(x)+a$ is the translation of the graph of $y=f(x)$ by a distance $a$ in the positive $y$-direction.
- The graph of $y=f(ax)$ is a stretch of the graph of $y=f(x)$ by a factor of $\frac{1}{a}$ parallel to the $x$-axis. If $a=-1$ then the transformation is a reflection in the $y$-axis. If $a$ is some other negative number then the transformation is a combination of that reflection and a stretch parallel to the $x$-axis.
- The graph of $y=af(x)$ is a stretch of the graph of $y=f(x)$ by a factor of $a$ parallel to the $y$-axis. If $a=-1$ then the transformation is a reflection in the $x$-axis.
Revision Questions
- Let $f(x)=x^2+4x+3$. Sketch the graph of $y=f(x+2)$.
Sketch the graph of $y=3 f( 2 x)$.
Sketch the graph of $y=2 f( 3 x)$. Is that the same as the previous graph?
Give an example of a function $g(x)$ such that $y=5g(4x)$ and $y=4g(5x)$ have the same graph. - Let $f(x)=x^3-x$. Sketch the graph of $y=2f(x+1)$.
Sketch the graph of $y=2f(x)+1$. Is that the same as the previous graph?
Give an example of a function $g(x)$ such that $y=3g(x)+2$ and $y=3g(x+2)$ have the same graph. - Sketch the graph of $y=x^n$ for various values of $n$; large, small, negative, positive, zero.
- Sketch the graph of $\sqrt{4x+1}$ for $x>-\frac{1}{4}$.
- Sketch the graph of $y=\log_2 x$. Sketch the graph of $y=\log_2 (x^2-2x+1)$.
- Sketch the graph of $y=\sin(x^2)$.
- Sketch the graph of $y=\sqrt{x^2}$.
- Sketch the graphs of $y=2^x$ and $y=\left(\frac{1}{2}\right)^{x}$ on the same axes. Describe the relationship between the graphs.
- Sketch the graph of $y=\cos 2x$. Sketch the graph of $\displaystyle y=\frac{1}{2} + \frac{1}{2}\cos 2x$.
- Sketch all the points $(x,y)$ that satisfy $y=4-x$.
Sketch all the points $(x,y)$ that satisfy $y=4-x^2$.
Sketch all the points $(x,y)$ that satisfy $y^2=4-x^2$. - Let $f(x)=\cos x$. Sketch all the points $(x,y)$ that satisfy $f(x)=f(y)$.
- Let $f(x)=x^3-x$. Sketch all the points $(x,y)$ that satisfy $f(x)=f(y)$.
- Sketch all the points $(x,y)$ that satisfy $x^4+2x^2y^2+y^4-3x^2-3y^2+2=0$.
- Sketch all the points $(x,y)$ that satisfy $x^6+3x^4y^2+3x^2y^4+y^6=1$.
- Sketch all the points $(x,y)$ that satisfy $xy+x^2y^2=x^3+y^3$.
MAT questions
MAT 2014 Q1I
The graph of the function \[y=2^{x^2-4x+3}\] can be obtained from the graph of $y=2^{x^2}$ by
(a) a stretch parallel to the $y$-axis followed by a translation parallel to the $y$-axis.
(b) a translation parallel to the $x$-axis followed by a stretch parallel to the $y$-axis.
(c) a translation parallel to the $x$-axis followed by a stretch parallel to the $x$-axis.
(d) a translation parallel to the $x$-axis followed by reflection in the $y$-axis.
(e) reflection in the $y$-axis followed by translation parallel to the $y$-axis.
Hints
- Note that "multiplying by $2^{-4x+3}$" isn't one of the options, sadly. We'll need to try harder to find a relationship between the functions.
- What would happen if we stretched the graph of $2^{x^2}$ parallel to the $y$-axis by a factor of $4$?
- What would happen if we translated the graph of $2^{x^2}$ parallel to the $x$-axis by one unit?
- Modify those transformations and apply them one after the other to achieve the graph of the function $2^{x^2-4x+3}$.
MAT 2017 Q1D (modified)
The diagram below shows the graph of $y = f(x)$.
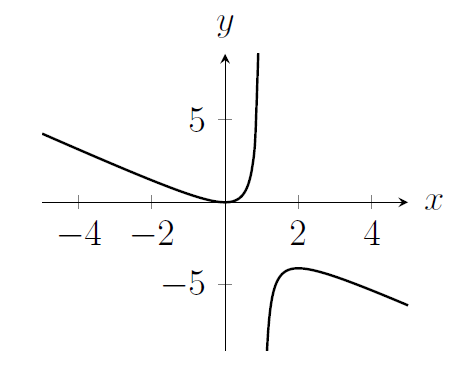
Sketch the graph of the function $y = -f(-x)$.
Hints
- What transformation(s) get us from $f(x)$ to $-f(-x)$?
- Describe some features of the graph of $y=f(x)$, and their locations.
- Describe what you expect to see in the transformed graph, describing the new locations of those features.
- Sketch a graph with those features.
MAT 2008 Q3
(i) The graph $y=f\left( x\right) $ of a certain function has been plotted below.

On the next three pairs of axes (A), (B), (C) are graphs of
\begin{equation*}
y=f\left( -x\right) ,\qquad f\left( x-1\right) ,\qquad -f\left( x\right)
\end{equation*}
in some order. Say which axes correspond to which graphs.
 falls, then rises, touches the x-axis from below, then falls. (B) falls, touches the x-axis, rises then falls. (C) rises, passes through the origin, falls, touches the x-axis, then rises.")
(ii) Sketch, on the same axes, graphs of both of the following functions
\begin{equation*}
y=2^{-x^{2}}\qquad \text{and}\qquad y=2^{2x-x^{2}}.
\end{equation*}
Carefully label any stationary points.
(iii) Let $c$ be a real number and define the following integral
\begin{equation*}
I\left( c\right) =\int_{0}^{1}2^{-\left( x-c\right) ^{2}}\,\text{d}x.
\end{equation*}
State the value(s) of $c$ for which $I\left( c\right) $ is largest. Briefly explain your reasoning.
[Note you are not being asked to calculate this maximum value.]
Hints
(i) Can you identify the graph corresponding to the translation first?
If you really really want to approach this algebraically, try to guess an expression for the function, such as $y=x^3-3x+2$, and then apply the transformations. But it should be possible to think about the transformations without being specific about an expression for the function.
(ii) These two graphs are related by a translation and/or scaling. See if you can find the precise relationship between the two graphs before you sketch either.
For $y=2^{-x^2}$, check what happens for $x$ large, small, positive, negative, zero.
You're not expected to be able to differentiate the functions here. Instead, remember that a stationary point might happen where the function reaches a local maximum. What's the maximum value of each of these functions?
(iii) Remember the extension on the previous worksheet, where we looked at $I(c)$ for a different integral, but where translation was important. Sketch $2^{-(x-c)^2}$ for various values of $c$.
Extension
[Just for fun, not part of the MAT question]
- The graphs in part (i) have some things in common and some differences.
List some features of a graph that are unchanged by translations, reflections, or scalings.
List some features that are may be changed by translations, reflections, or scalings. - Sketch $y=f(x^2)$ with $f(x)$ as in part (i).
Sketch $y=f(x)^2$.
Sketch $y^2=f(x)^2$.
Sketch $y^2=f(x^2)$.
MAT 2017 Q3
For each positive integer $k$, let $f_k(x) = x^{1/k}$ for $x \geqslant 0$.
(i) On the same axes, labelling each curve clearly, sketch $y = f_k(x)$ for $k = 1, 2, 3$ indicating the intersection points.
(ii) Between the two points in (i), the curves $y=f_k(x)$ enclose several regions. What is the area of the region between the graphs of $y=f_k(x)$ and $y=f_{k+1}(x)$? Verify that the area of the region between $f_1$ and $f_2$ is $\frac{1}{6}$.
Let $c$ be a constant where $0<c<1$.
(iii) Find the $x$-coordinates of the points of intersection of the line $y=c$ with $y=f_1(x)$ and of $y=c$ with $y=f_2(x)$.
(iv) The constant $c$ is chosen so that the line $y = c$ divides the region between $y=f_1(x)$ and $y=f_2(x)$ into two regions of equal area. Show that $c$ satisfies the cubic equation $4c^3 - 6c^2 + 1 = 0$. Hence find $c$.
Hints
(i) The notation $f_k(x)$ might seem a bit confusing (it's the notation that we would use for a sequence of functions). If in doubt, you can replace $f_1(x)$ with $x^1$ whenever you see it, and $f_2(x)$ with $x^{1/2}$, and so on.
What does the graph of $y=x^{1/2}$ look like? Sometimes it's helpful to quickly take the derivative to check if the function is increasing or decreasing, and whether that rate of change is large or small.
The intersection points between $f_1$ and $f_2$ come when $x=x^{1/2}$. What do you notice about the solutions to that equation? What do you wonder?
(ii) The area between two graphs can be thought of as the area under the higher curve minus the area under the lower curve. You might like to draw a separate sketch to convince yourself of this!
That means that we can approach this with integration, even though we don't know the value of $k$.
"Verify" means "check". For the last bit of this part of the question, we're being asked to check that in the special case where $k=1$, our general answer gives the correct value.
(iii) You might like to draw the line $y=c$ onto your sketch from before, or draw a new sketch with that line included.
You'll need to solve some equations to find the points of intersection, but don't expect very complicated answers (because the functions $f_1$ and $f_2$ are not very complicated).
(iv) Remember that the overall area between $f_1$ and $f_2$ is $\frac{1}{6}$.
How large would you like each of the two regions to be?
At this point it's very helpful to have a sketch, so that you can decide how to use integration to find the area of one of the two regions.
Extension
[Just for fun, not part of the MAT question]
- Suppose that the line $y=c$ divides the region between $y=f_k(x)$ and $y=f_{k+1}(x)$ into two regions of equal area. Show that $c$ satisfies the equation $$2(k+2)c^{k+1}-2(k+1)c^{k+2}-1=0.$$