Graphs Solutions
This resource is part of the 2025 archive of the Oxford MAT Livestream. Click or tap here or on the image below for the new and updated livestream admissions support programme from Oxford Mathematics.

Revision Questions
1. Note that $x^2+4x+3=(x+3)(x+1)$. The graph of $y=f(x+2)$ is the graph of $y=f(x)$ after it has been translated two units to the left.
 has roots at -3 and -1. Right: f(x+2) has roots at -5 and -3.")
For $y=3f(2x)$, the graph is "squashed" by a factor of 2 parallel to the $x$-axis, then "stretched" by a factor of 3 parallel to the $y$-axis.

For $y=2 f( 3 x)$, the graph is squashed by a factor of 3 parallel to the $x$-axis, then stretched by a factor of 2 parallel to the $y$-axis

It's not the same as the previous graph. For example, the roots aren't in the same places.
$g(x)=x$ works for the last part; then $y=20x$ in both cases.
2. The graph of $y=f(x)$ and the graph of $y=2f(x+1)$;
=x^3-x has roots at -1 and 0 and 1. 2f(x+1) has roots at -2 and -1 and 0.")
The graph of $y=2f(x)+1$;

It's not the same as the previous graph. We could compare, for example, the values of $2f(x+1)$ and $2f(x)+1$ when $x=0$.
$g(x)=x/3+c$ for any constant $c$ works for the last part.
3. For large $n$, $y=x^n$ is close to zero between $-1$ and $1$. For small positive $n<1$, $y=x^n$ is approximately $1$ between $0$ and $1$. For negative $n$, the graph increases to infinity near $x=0$.
 grows at a rate that slows. x^(-1/2) is very large near zero and falls down to zero.")
4. Note that $\sqrt{4x+1}=2\sqrt{x+\frac{1}{4}}$ so this is a translation of the graph of $y=\sqrt{x}$ by $\frac{1}{4}$ units in the negative $x$-direction followed by a stretch parallel to the $y$-axis with scale factor 2.

5. Note that $\log_2(x^2-2x+1)=\log_2((x-1)^2)$.
 goes through zero at 1. log_2(x^2-2x+1) starts at zero, falls rapidly down to minus infinity at 1, then rises just as quickly, in time to be zero at x=2, before slowly rising onwards")
6. The function $\sin(x^2)=0$ when $x^2= 180^\circ n$ for $n$ a whole number, so the graph crosses the $x$-axis more and more frequently as $x$ increases. The graph has reflectional symmetry in the $y$-axis.

7. If $x\geq0$ then $\sqrt{x^2}=x$ but if $x<0$ then $\sqrt{x^2}=-x$, because $\sqrt{u}$ is always the positive root.

8. The graph of $y=2^x$, and the graph of $y=2^{-x}$.
 is its mirror image.")
One is the reflection of the other, reflecting in the $y$-axis.
9. The graph of $y=\cos 2x$, and the graph of $y=\frac{1}{2} + \frac{1}{2}\cos 2x$.
 is an oscillating function with range between minus 1 and 1. Right: 1/2+(1/2)cos(2x) is an oscillating function with range between 0 and 1.")
10. The equation $y=4-x$ is the equation of a straight line.
The equation $y=4-x^2$ is the equation of a parabola.
The equation $x^2=4-y^2$ is the equation of a circle with radius 2.
 to (4,0). y=4-x^2 is a parabola with peak at (0,4) and roots at 2 and -2. y^2=4-x^2 is a circle with radius 2.")
11.. If $\cos x = \cos y$ then either $x=y$, or $x=y+360^\circ n$ for some whole number $n$, or $x+y=360^\circ n$ for some whole number $n$. These are the equations of lines.

12. It's possible that $x=y$, but because $f(x)=x^3-x$ is not a one-to-one function, there are other points $(x,y)$ that we must consider. For some values of $c$ there are three solutions to $x^3-x=c$.

13. The equation $x^4+2x^2y^2+y^4-3x^2-3y^2+2=0$ simplifies to $(x^2+y^2)^2-3(x^2+y^2)+2=0$, which is a quadratic for $x^2+y^2$, with roots $x^2+y^2=1$ or $x^2+y^2=2$. This is a pair of circles.

14. The equation $x^6+3x^4y^2+3x^2y^4+y^6=1$ simplifies to $(x^2+y^2)^3=1$ so we have $x^2+y^2=1$ and this is a circle.

15. The equation rearranges to $x^3-xy=x^2y^2-y^3$. Take out a factor of $x$ on the left and $y^2$ on the right to factorise this as $x(x^2-y)=y^2(x^2-y)$ so either $x^2=y$ or $x=y^2$. This is a pair of parabolas.

MAT Questions
MAT 2014 Q1I
- A translation parallel to the $x$-axis would give us something like $2^{(x-a)^2}$.
- A stretch parallel to the $y$-axis would give us something like $b\times 2^{x^2}$, and if we write $b=2^c$ then this would be $2^{x^2+c}$.
- If we complete the square, we find $x^2-4x+3=(x-2)^2-1$
- So $$2^{x^2-4x+3}=2^{(x-2)^2-1}=2^{(x-2)^2}\times 2^{-1}.$$
- This is what we would get from a translation parallel to the $x$-axis followed by a stretch parallel to the $y$-axis.
- The answer is (b).
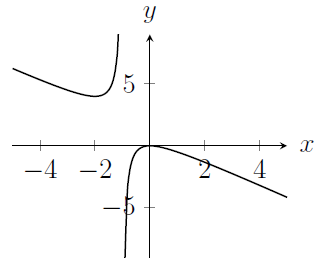
MAT 2017 Q1D
- The graph has been reflected in the $x$-axis and reflected in the $y$-axis to get from $y=f(x)$ to $y=-f(-x)$ (you might have used the phrase "stretch by a factor of $-1$", which means the same thing)
- Looking at the graph, there is a point at about $x=1$ where the values of $f(x)$ are very large (either positive or negative), outside the range of this plot. So our transformed graph should have something similar around $x=-1$.
- Looking at the graph again, there are values of $y$ between about $-4$ and $0$ for which there's no graph (there are no values of $x$ such that $y=f(x)$ for those values of $y$). After the reflections, this region will appear between $y=0$ and about $y=4$.
- The overall sort of shape of the graph won't be distorted by the reflections.
My sketch looks something like this;
MAT 2008 Q3
(i) The graph $y=f(-x)$ represents a reflection in the $y$-axis.
The graph $y=f(x-1)$ represents a translation by 1 unit in the positive $x$-direction.
The graph $y=-f(x)$ represents a reflection in the $x$-axis.
Trying these on the graph that we're given for $y=f(x)$, I get something that looks like $(A)$ or $(B)$ for the first and third transformations, while the graph $(C)$ is clearly the translation. Looking at the axes, I can see that $(A)$ is the reflection in the $x$-axis.
So $y=f(-x)$ is $(B)$, $y=f(x-1)$ is $(C)$, and $y=-f(x)$ is $(A)$.
(ii) Note that $-x^2\leq 0$, and gets very negative very quickly as $x$ gets large (no matter whether $x>0$ or $x<0$). We also know that, if $u$ is very negative, then $2^u$ is close to zero. The graph will have reflectional symmetry in the $y$-axis, and the $y$-intercept is $1$.
 sits symmetrically on the x-axis, its peak at (0,1).")
The maximum value of $2^{-x^2}$ comes where $-x^2$ is maximised, which happens when $x=0$. The stationary point here has coordinates $(0,1)$.
Now note that $2x-x^2=-(x-1)^2+1$ if we complete the square. So
$$
2^{2x-x^2}=2\times 2^{-(x-1)^2}
$$
This is a translation by 1 unit in the positive $x$-direction, followed by a stretch parallel to the $y$-axis with scale factor 2. The $y$-intercept is 1 again, so the graphs intersect there. After the translations, the stationary point is now at $(1,2)$. My sketch now looks like this;

(iii) Note that $2^{-(x-c)^2}$ is just a translation of $2^{-x^2}$. We want the area under the graph between 0 and 1 to be large, so we want the big bit of the graph to be in that range. Let's park it right in the middle with $c=\frac{1}{2}$.
Extension
- Things that are unchanged; number of turning points, degree of the polynomial (if they're polynomials), and more.
Things that might change; number of roots, behaviour for large $x$, $y$-intercept, value at $x=37$, and more. - The graph of $f(x^2)$ just uses the part of the graph of $y=f(x)$ where $x\geq 0$, and there's some distortion. For this function $f(x)$, the values happen to be positive in $x\geq 0$. This graph will have reflectional symmetry in the $y$-axis.
The graph of $y=f(x)^2$ takes values of $f(x)$ and squares them, so it'll definitely get a positive result. There's no obvious symmetry to this graph.
If $y^2=f(x)^2$ then either $y=f(x)$ or $y=-f(x)$. This graph will have reflectional symmetry in the $x$-axis.
For $y^2=f(x^2)$ we have to take our previous graph of $f(x^2)$ and imagine taking the square root of the values, and also the negative of that. This graph will have reflectional symmetry in both the $x$-axis and the $y$-axis.
 is W-shaped, touching the x-axis twice. f(x)^2 is a distorted W shape, with the second half flattened out near (1,0). y^2=f(x)^2 is the original cubic and its mirror image in the x-axis. y^2=f(x^2)is a bit like two intersecting parabolas, one upward-pointing, and one downward-pointing.")
MAT 2017 Q3
(i) We're being asked to sketch $y=x$ and $y=\sqrt{x}$ and $y=\sqrt[3]{x}$.
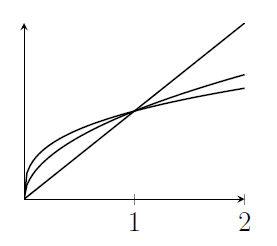
Note that all three graphs pass through the points $(0,0)$ and $(1,1)$.
(ii) The intersection points we found in the previous part are in fact intersection points for any pair of functions $f_k$ and $f_{k+1}$. So the region we're looking at in this part lies between $x=0$ and $x=1$.
To calculate the area between $y=x^{1/k}$ and $y=x^{1/(k+1)}$, we'll need to integrate.
$$\int_0^1 x^{1/(k+1)}-x^{k}\,\mathrm{d}x=\left[\frac{x^{1+1/(k+1)}}{1+1/(k+1)} - \frac{x^{1+1/k}}{1+1/k}\right]_0^1=\frac{k+1}{k+2}-\frac{k}{k+1}. $$
This fraction simplifies a bit, as follows; $$\frac{k+1}{k+2}-\frac{k}{k+1}=\frac{(k+1)^2-k(k+2)}{(k+1)(k+2)}=\frac{1}{(k+1)(k+2)}.$$
The value when $k=1$ is $1/(2\times 3)$.
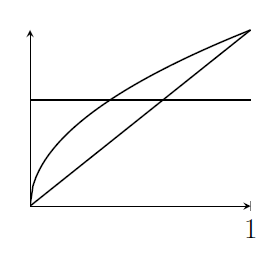
(ii) First we're looking for the point of intersection of $y=c$ with $y=x$. That's at $(c,c)$.
Then the point of intersection of $y=c$ with $y=\sqrt{x}$ occurs when $x=c^2$, so the point is at $(c^2,c)$.
(iii) The situation is as follows;
The region above the line $y=c$ looks easier to calculate, to me. I'll find that area by integrating $y=\sqrt{x}$ from $x=c^2$ to $x=1$ and then subtracting a rectangle and a triangle.
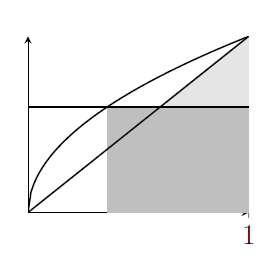
That means that to find the area of the region above the line, I want$$\int_{c^2}^1 \sqrt{x}\,\mathrm{d}x - c(1-c^2)-\frac{1}{2}(1-c)^2$$
which is$$\frac{2}{3}(1-c^3)-c+c^3-\frac{1}{2}+c-\frac{1}{2}c^2.$$
In order for this to be half of the total region between $f_1$ and $f_2$, this area needs to be equal to $\frac{1}{12}$. Simplifying a bit, we want$$\frac{1}{6}+\frac{1}{3}c^3-\frac{1}{2}c^2=\frac{1}{12}$$
Now multiply both sides by 12 and rearrange some more for $4c^3-6c^2+1=0$.
Finally, we're asked to find $c$. It's somewhere between $0$ and $1$. Let's try $1/2$. That works!
There can't be any other solutions in that range, because as the line $y=c$ moves upwards, the area of the region above the line only decreases (so it can't be $\frac{1}{12}$ twice).
Extension
- These areas are easier to calculate if we reflect in the line $y=x$ by switching $y$ and $x$. The curves become $y=x^k$ and $y=x^{k+1}$, and we're looking for the value of $c$ such that the line $x=c$ splits the region between those curves into equal parts. So we just need $$\int_0^c x^{k}-x^{k+1}\,\mathrm{d}x=\frac{1}{2(k+1)(k+2)}$$
where I've used the result from part (ii).
This simplifies to the given expression.