Solutions
Part of the Oxford MAT Livestream
These are the solutions for the Graphs & Transformations worksheet. You should have a go at sketching the graphs before looking at mine!
Warm-up
1. Sketch $y=ax^2+bx+c$ in each of the following eight cases;
- $a>0$, $b>0$, $c>0$. There could be 0 or 1 or 2 roots.

- $a>0$, $b>0$, $c<0$. Must have two roots.
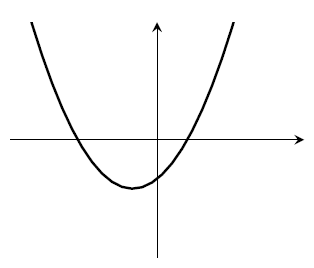
- $a>0$, $b<0$, $c>0$. There could be 0 or 1 or 2 roots.

- $a>0$, $b<0$, $c<0$. Must have two roots.
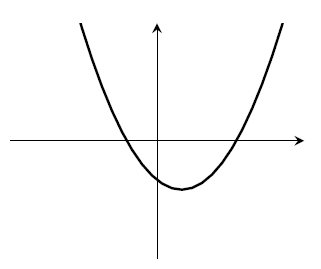
- $a<0$, $b>0$, $c>0$. Must have two roots.
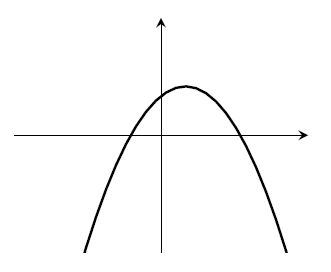
- $a<0$, $b>0$, $c<0$. There could be 0 or 1 or 2 roots.

- $a<0$, $b<0$, $c>0$. Must have two roots.
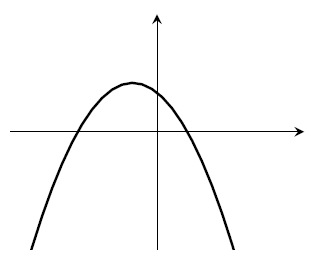
- $a<0$, $b<0$, $c<0$. There could be 0 or 1 or 2 roots.

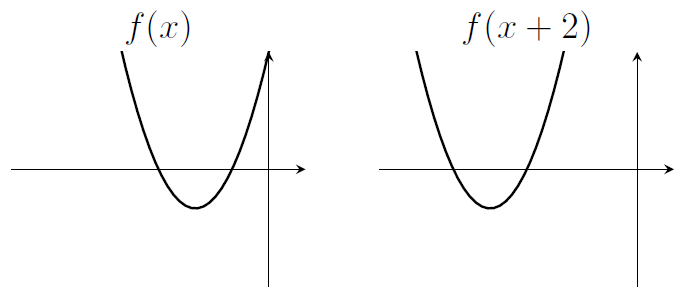
2. Let $f(x)=x^2+4x+3$. Sketch the graph of $y=f(x+2)$.
- Note that $x^2+4x+3=(x+3)(x+1)$. The graph of $y=f(x+2)$ is the graph of $y=f(x)$ after it has been translated two units to the left.
3. Sketch the graph of $y=3 f( 2 x)$.
- The graph is "squashed" by a factor of 2 parallel to the $x$-axis, then "stretched" by a factor of 3 parallel to the $y$-axis.
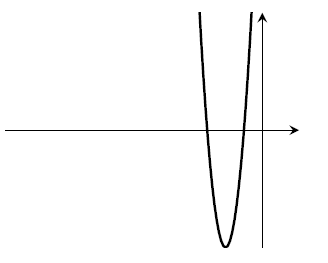
4. Sketch the graph of $y=2 f( 3 x)$. Is that the same as the previous graph?
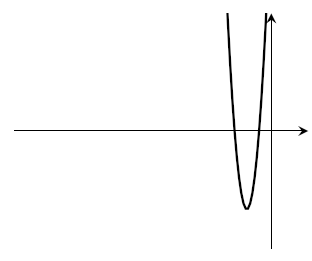
- No. For example, the roots aren't in the same places. We could also check that $3\left((2x)^2+4(2x)+3\right)$ isn't the same thing as $2\left((3x)^2+4(3x)+3\right)$, but that feels like a lot of work.
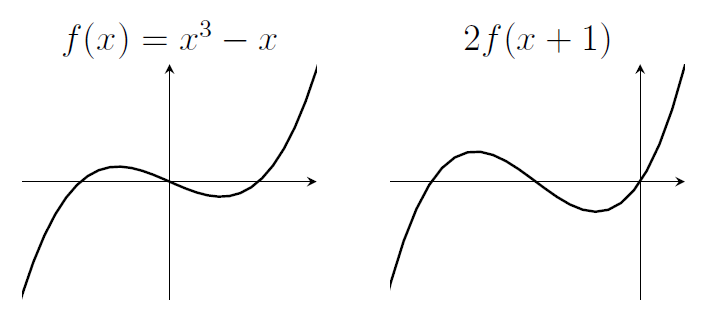
5. Let $f(x)=x^3-x$. Sketch the graph of $y=2f(x+1)$.
6. Sketch the graph of $y=2f(x)+1$. Is that the same as the previous graph?
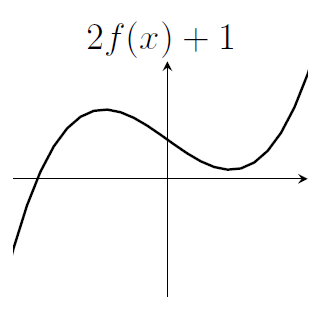
- No. We could compare, for example, the values of $2f(x+1)$ and $2f(x)+1$ when $x=0$. Those are $2f(1)$ and $2f(0)+1$, which are 0 and 1, so not the same. Note that even if these values were the same, then the graphs might still be different (this is just a spot-check at $x=0$).
7. Sketch the graph of $y=\log_2 x$. Sketch the graph of $y=\log_2 (x^2)$.
- Note that $\log_2(x^2)=2\log_2 x$

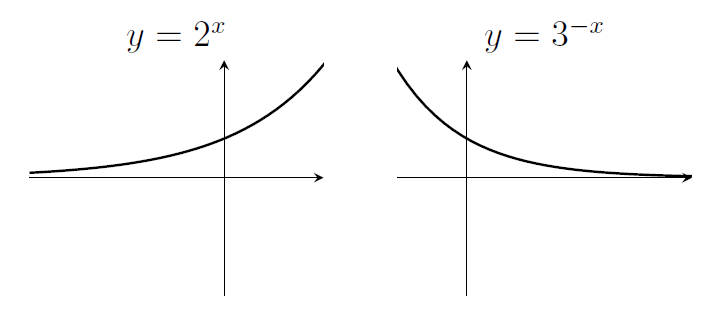
8. Sketch the graph of $y=2^x$. Sketch the graph of $y=\left(\frac{1}{3}\right)^{x}$.
9. Sketch the graph of $y= x\sqrt{2}$. Does the graph go through the point $\displaystyle \left(\frac{p}{q},\frac{r}{s}\right)$ for any positive whole numbers $p$, $q$, $r$, $s$?
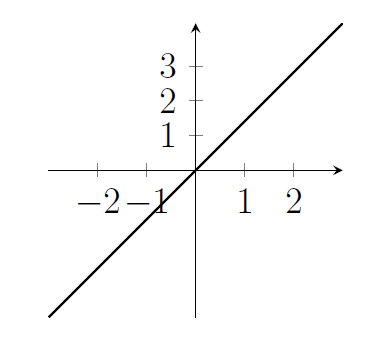
- Let's suppose that $\displaystyle \frac{r}{s}=\sqrt{2}\times\frac{p}{q}$. Then we would have $\displaystyle\sqrt{2}=\frac{qr}{ps}$. But $\sqrt{2}$ is irrational, so we can't have $p,q,r,s$ all be positive whole numbers, or we would have written $\sqrt{2}$ as a fraction.
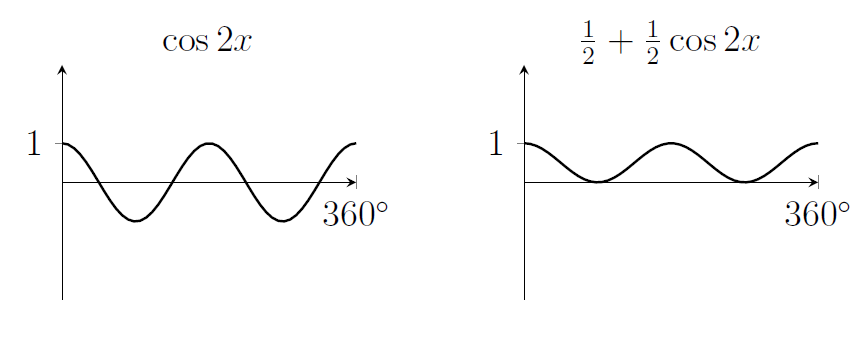
10. Sketch the graph of $y=\cos 2x$. Sketch a graph of $y=\frac{1}{2} + \frac{1}{2}\cos 2x$.
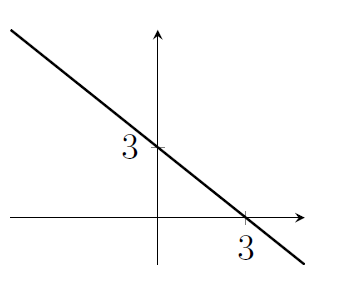
11. Sketch all the points $(x,y)$ that satisfy $x+y=3$.
- That's the straight line $y=3-x$.
12. Sketch all the points $(x,y)$ that satisfy $y^2=9x$.
- We could have $y=3\sqrt{x}$ or $y=-3\sqrt{x}$.
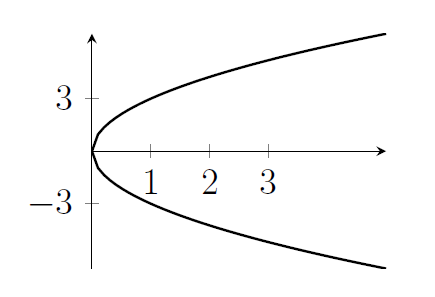
- Alternatively, if you switch $x$ and $y$ you get a parabola. Switching $x$ and $y$ is a reflection in the line $y=x$ (not on the list of transformations on the MAT syllabus, but you might have come across it).
13. Sketch all the points $(x,y)$ that satisfy $x^2=4-y^2$.
- That's the circle $x^2+y^2=4$.
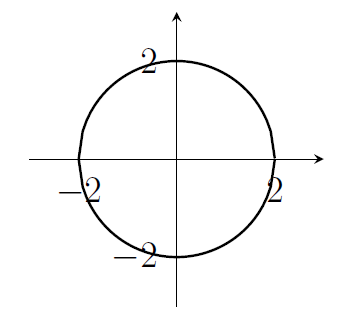
- Note that for these last two, there is no function $y=f(x)$ that covers all of the points in the sketch, because there are some values of $x$ where there are two or more points that satisfy the equation. A classic question that's like this is "sketch all the points $(x,y)$ that satisfy $\cos(x)=\cos(y)$".
MAT questions
MAT 2015 Q1I
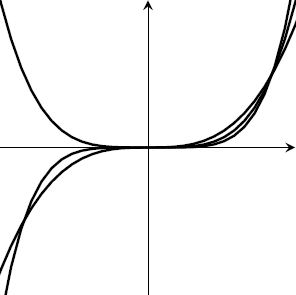
- First draw a rough sketch. When $x>0$ all the values are positive. When $x<0$ two of them are negative and one is positive. All the graphs go through $(0,0)$ and $(1,1)$ and two of them go through $(-1,-1)$. There are no other points of intersection.
- Now count the regions; there are some big regions like the one above all the graphs and the region below all the graphs. Over in $x<0$ there are three more regions. For $x>0$ it's a bit more complicated; we've counted the region below all three graphs and the region above all three graphs, but there are four more regions in between the graphs (two in $0<x<1$ and then two regions in $x>1$).
- Overall that adds up to nine regions.
- The answer is (d).
MAT 2014 Q1B
- The function inside the brackets is $(x-1)^2+1$. That's always positive (so this logarithm is always defined), and in fact it's always bigger or equal to one, so this logarithm will only give us positive values.
- The particular value $x=1$ is interesting, because that's the location of the minimum of the quadratic inside the brackets. At that value of $x$, we have $y=\log_{10} 1=0$. So the graph includes the point $(1,0)$. Only one of the options does that.
- The answer is (e).
MAT 2017 Q1D
- First, let's look at the main features of $f(x)$. It's got very large absolute value near $x=1$. For large $x$ (either positive or negative) it looks a bit like the straight line $y=-x$ to me.
- Now let's think about $y=f(-x)$. That would be the result of a reflection in the $y$-axis, so we would get a graph with big values near $x=-1$ and which looks like $y=x$ for large $x$.
- Now think about $y=-f(-x)$. That would be a reflection of the previous graph in the $x$-axis, so we would get a graph with big values near $x=-1$ and which looks like $y=-x$ for large $x$.
- Only one of the graphs does that.
- The answer is (c).
MAT 2013 Q3
(i) We've got to be careful, because $f(x)$ changes sign in between 0 and 2. We want the integral from 0 to $k$, then we want to subtract the integral from $k$ to 2 because the function is negative in that region (and areas are positive). So we want \[A(k)=\int_0^k f(x)\,\mathrm{d}x-\int_k^2 f(x)\,\mathrm{d}x.\]
(ii) We know that $f_k(x)$ is a cubic polynomial, but it's a little bit complicated because that polynomial involves $k$. If we multiply out the middle bracket of $f_k(x)$, then we get \[f_k(x)=x^2(x-2) - kx(x-2),\] so the integral \[\int f(x)\,\mathrm{d}x= \int x^2(x-2)\,\mathrm{d}x-k\int x(x-2)\,\mathrm{d}x.\]
That's removed $k$ from the function inside each integral. When we do these integrals we'll get a degree-4 polynomial that doesn't depend on $k$ and degree-3 polynomial that's multiplied by $k$. We have two definite integrals, each of which involves plugging $k$ into those polynomials. So we we'll end up with a degree-4 polynomial in $k$ and a degree-3 polynomial in $k$ that's multiplied by $k$. Overall, that's a polynomial in $k$ of degree at most 4 ("at most" because the coefficient of $k^4$ might cancel between the two terms).
(iii) If we replace $x$ with $1+t$ then we get $f_k(1+t)=(1+t)(1+t-k)(1+t-2)$. Now I've got to really concentrate to work out $-f_{2-k}(1-t)$. I need to take $f_k(x)=x(x-k)(x-2)$ and replace every $x$ with $1-t$ and replace every $k$ with a $2-k$. And remember the minus sign out the front. I get \[-f_{2-k}(1-t)=(1-t)(1-t-(2-k))(1-t-2)=(1-t)(k-1-t)(t+1)\] where I've done some tidying up to get the last expression. That does match the expression for $f_k(1+t)$.
(iv) Let's interpret the previous result in terms of transformations. On the left, we've got the graph of $f_k(t)$, but it's been translated to the left by a distance of 1. On the right, we've got the graph of $f_{2-k}(t)$, but... it's had the $t$ switched to a $1-t$. What's that? It's what would happen if we replaced $t$ with $1+t$ and then replaced $t$ in that new expression with $-t$. So that's a translation by one unit to the left and then a reflection in the $y$-axis. We actually have $-f_{2-k}(1-t)$ with a minus sign out the front, which represents a reflection in the $x$-axis.
So putting this together, if we take the graphs of $f_k(t)$ and $f_{2-k}(t)$ and translate them both one unit to the left, then we reflect the second graph in the $y$-axis and in the $x$-axis, we get the same graph (those things are equal by the previous question part). Said differently without the translation, $f_{2-k}(t)$ is what we get if we reflect $f_k(t)$ in the line $x=1$ and in then in the $x$-axis.
Those reflections don't affect the area, so $A(k)$, the area for $f_k(x)$, is the same as the area $A(2-k)$ for $f_{2-k}(x)$.
(v) We know that $A(k)$ is a degree-4 polynomial. We can write it as $A(k)=a(k-1)^4+d(k-1)^3+b(k-1)^2+f(k-1)+c$, where I've chosen unusual names for the coefficients so that it matches with the answer I'm working towards. We just need to prove that $d=0$ and $f=0$. We've got the fact $A(2-k)=A(k)$. If we plug in $2-k$ into our expression for $A(k)$ and equate coefficients, we get $d=0$ and $f=0$. That leaves the expression in the question.
Reflection
- In the long question we thought about some reflections. In general, $f(2-x)$ is the reflection of $f(x)$ in the line $x=1$ (note; not $x=2$). We can do something similar for reflections in other lines $x=c$.
- In one of the warm-up problems we thought about reflecting in the line $y=x$ by switching $x$ with $y$. That's a bit harder to imagine. Reflecting in the line $y=mx$ is very fiddly; there's an equation for it, but you don't need to know it for MAT.


